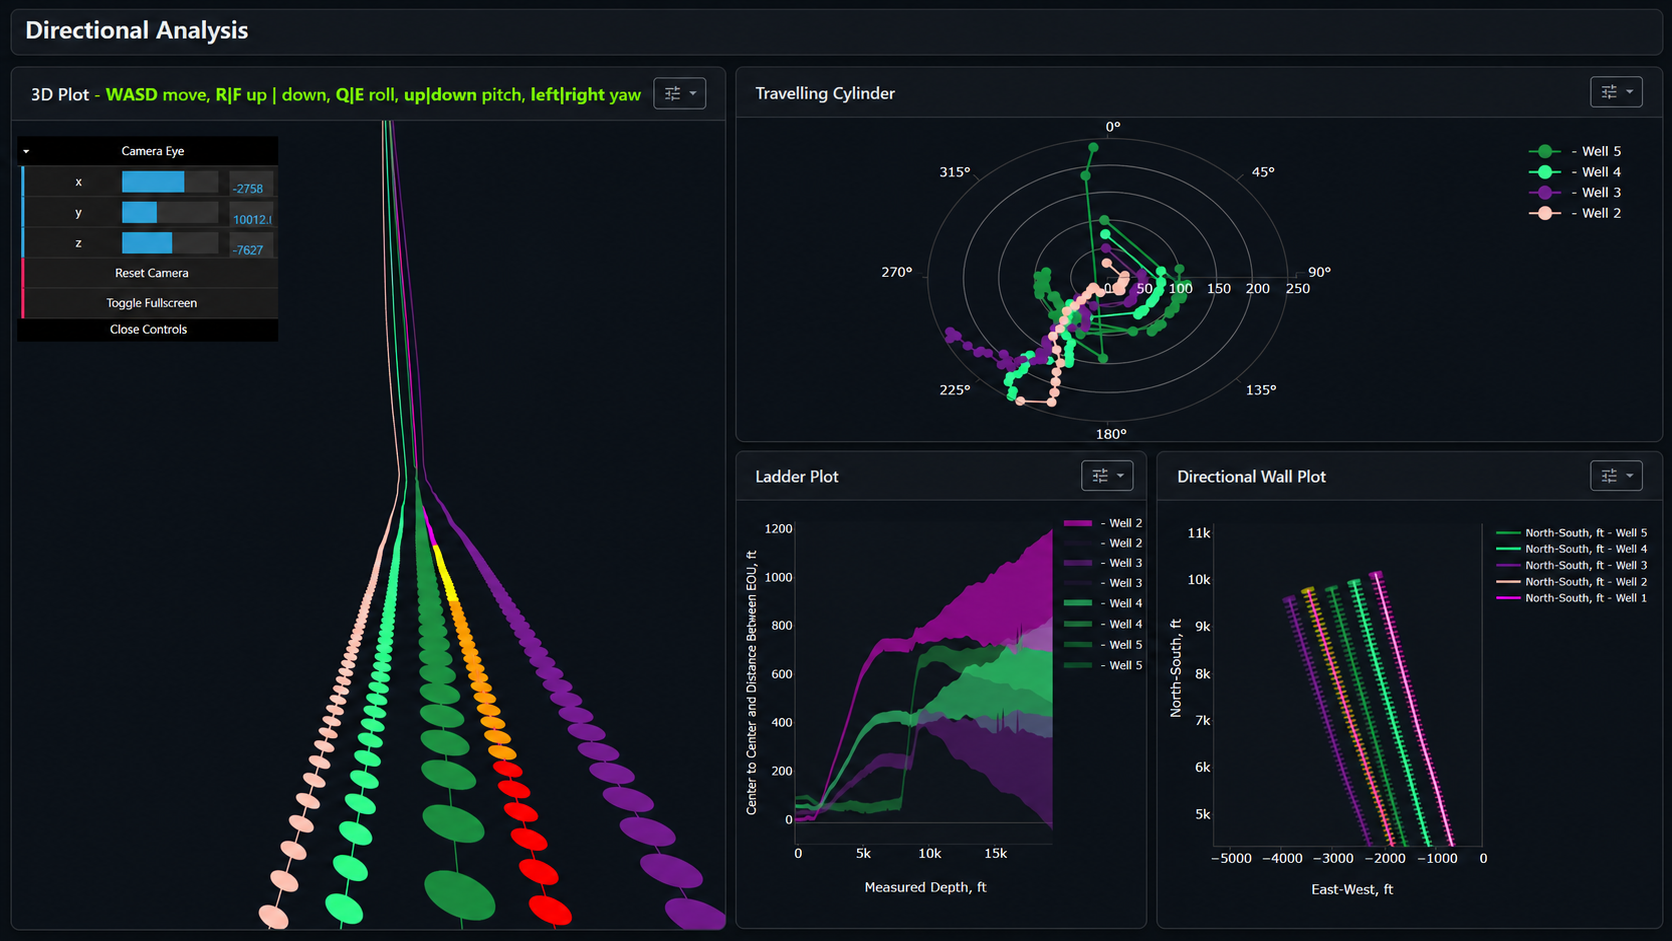
Directional Analysis
Quantify BHA build and walk tendencies by interval
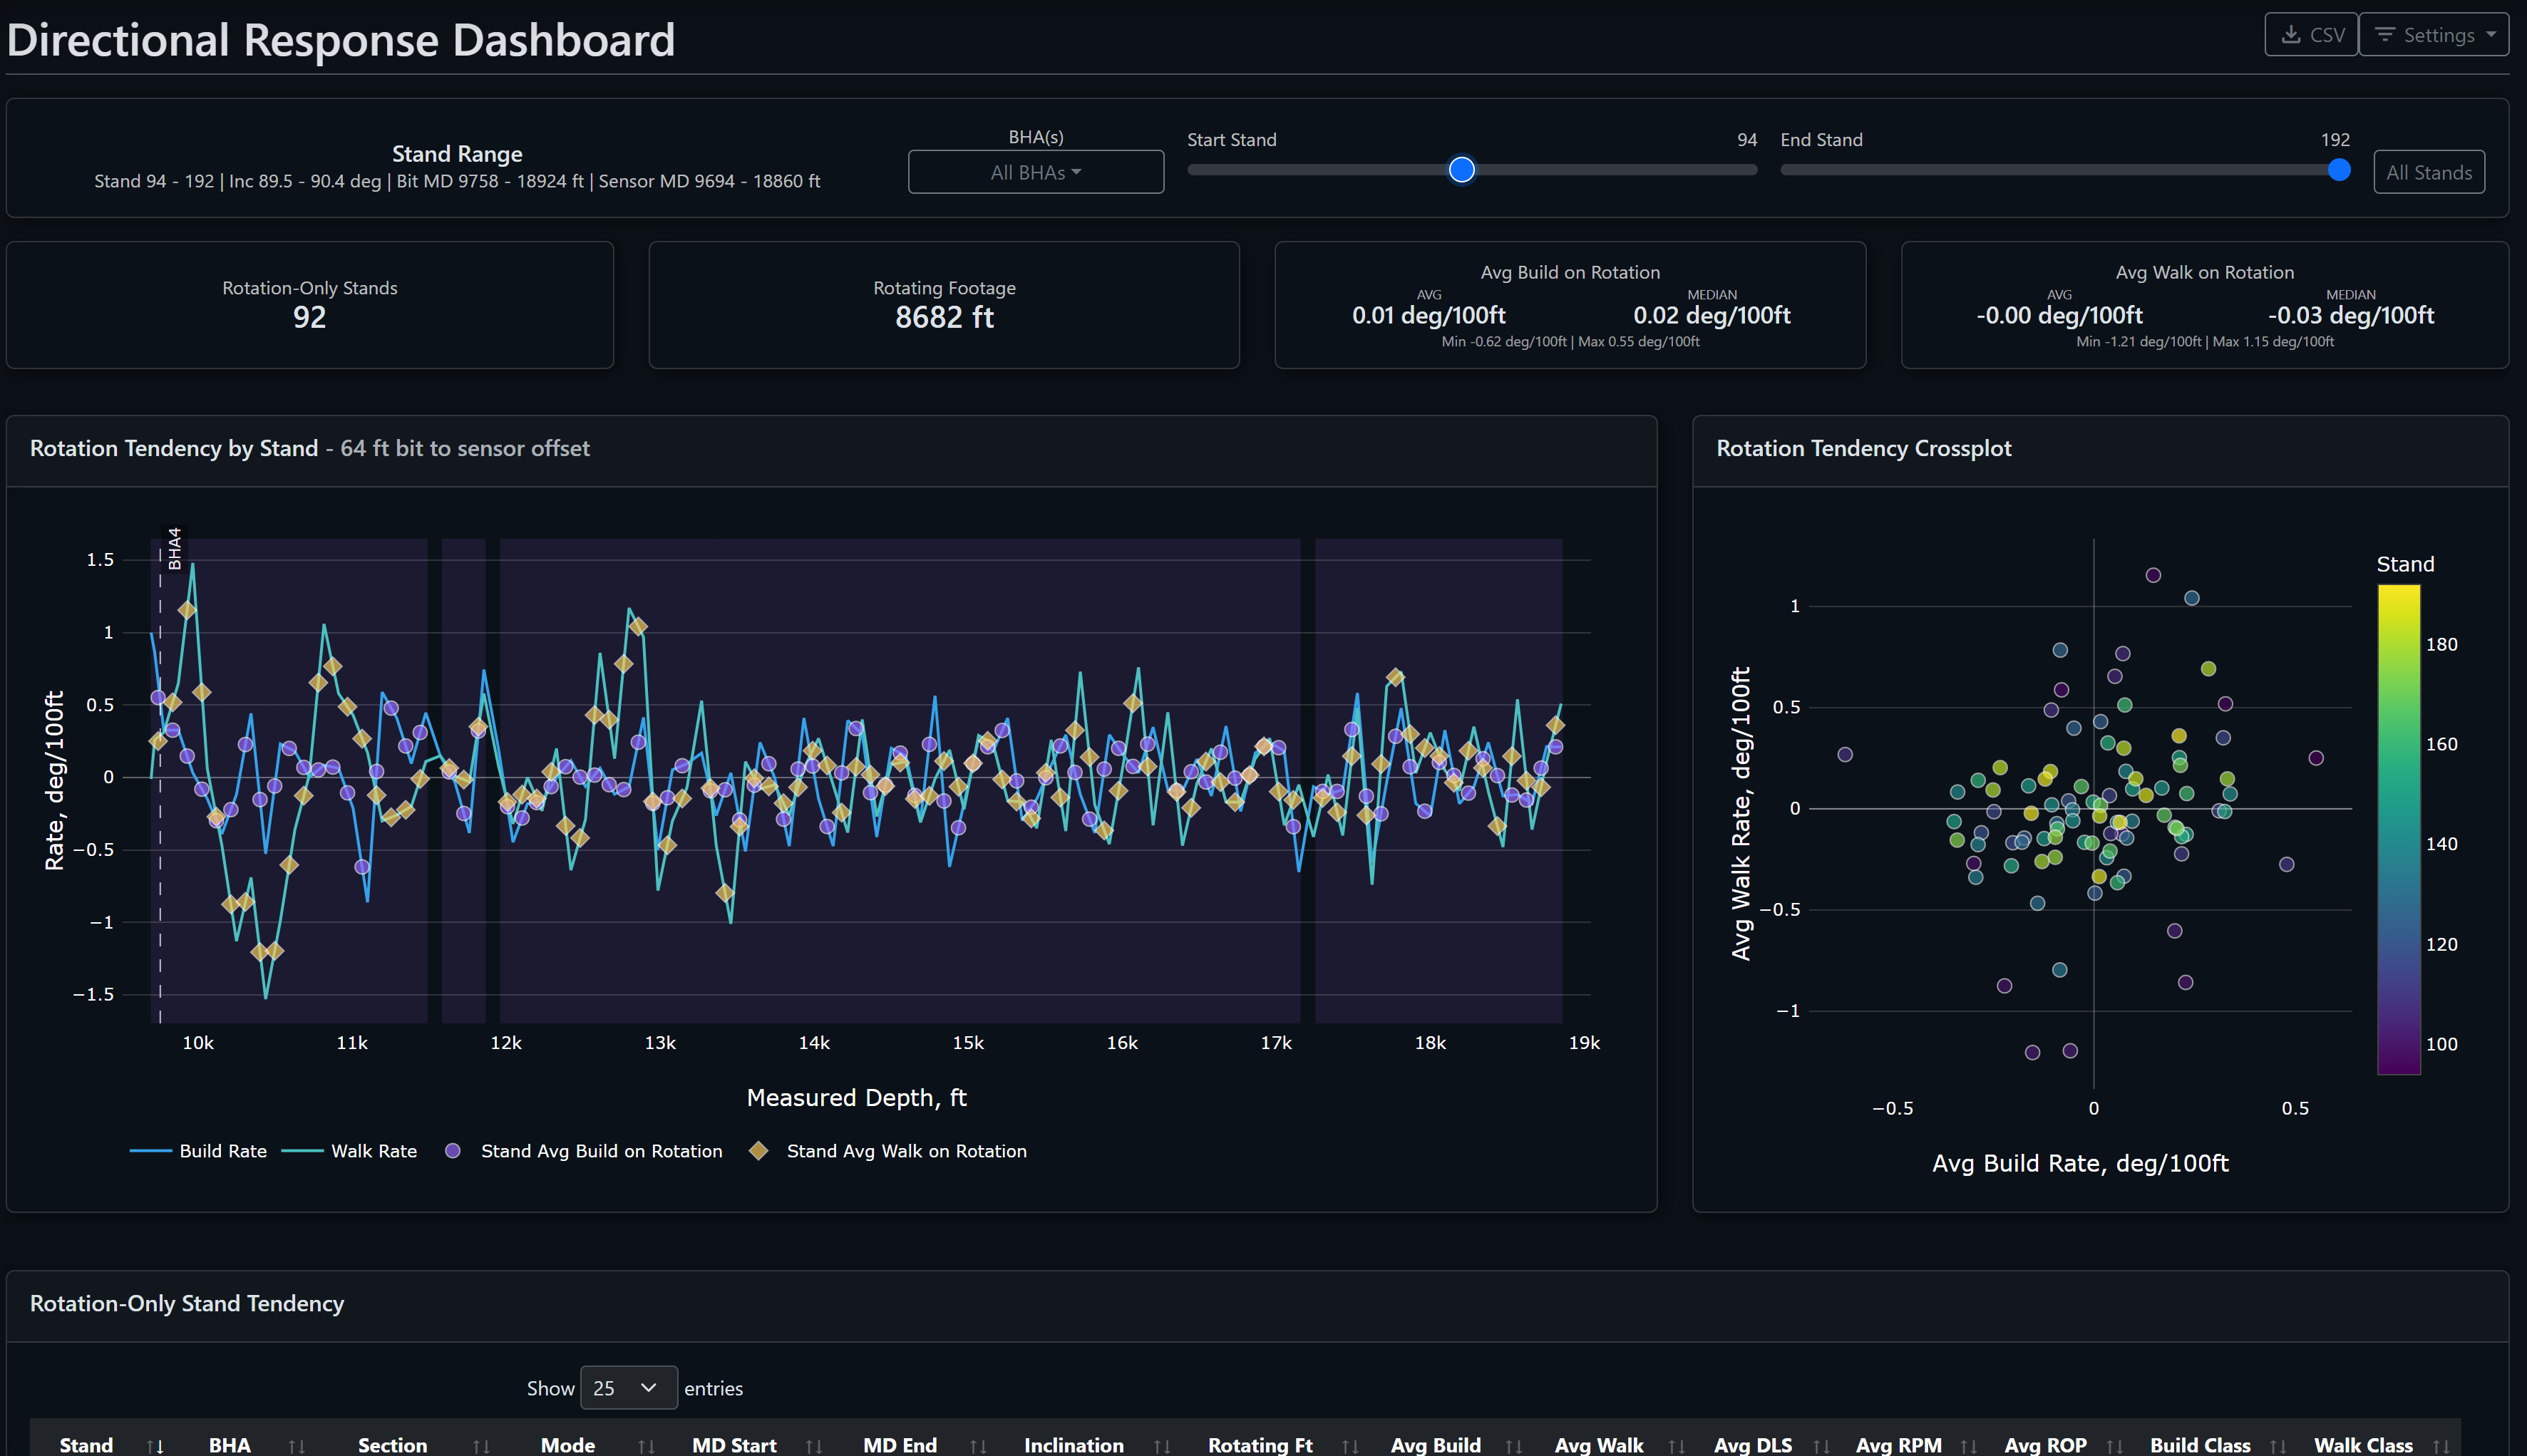
The Directional Response Dashboard evaluates rotation-only stands by BHA, formation interval, and operating window to show where build and walk tendencies repeat and where the evidence remains mixed.
- Rotation-only response
- Formation and BHA context
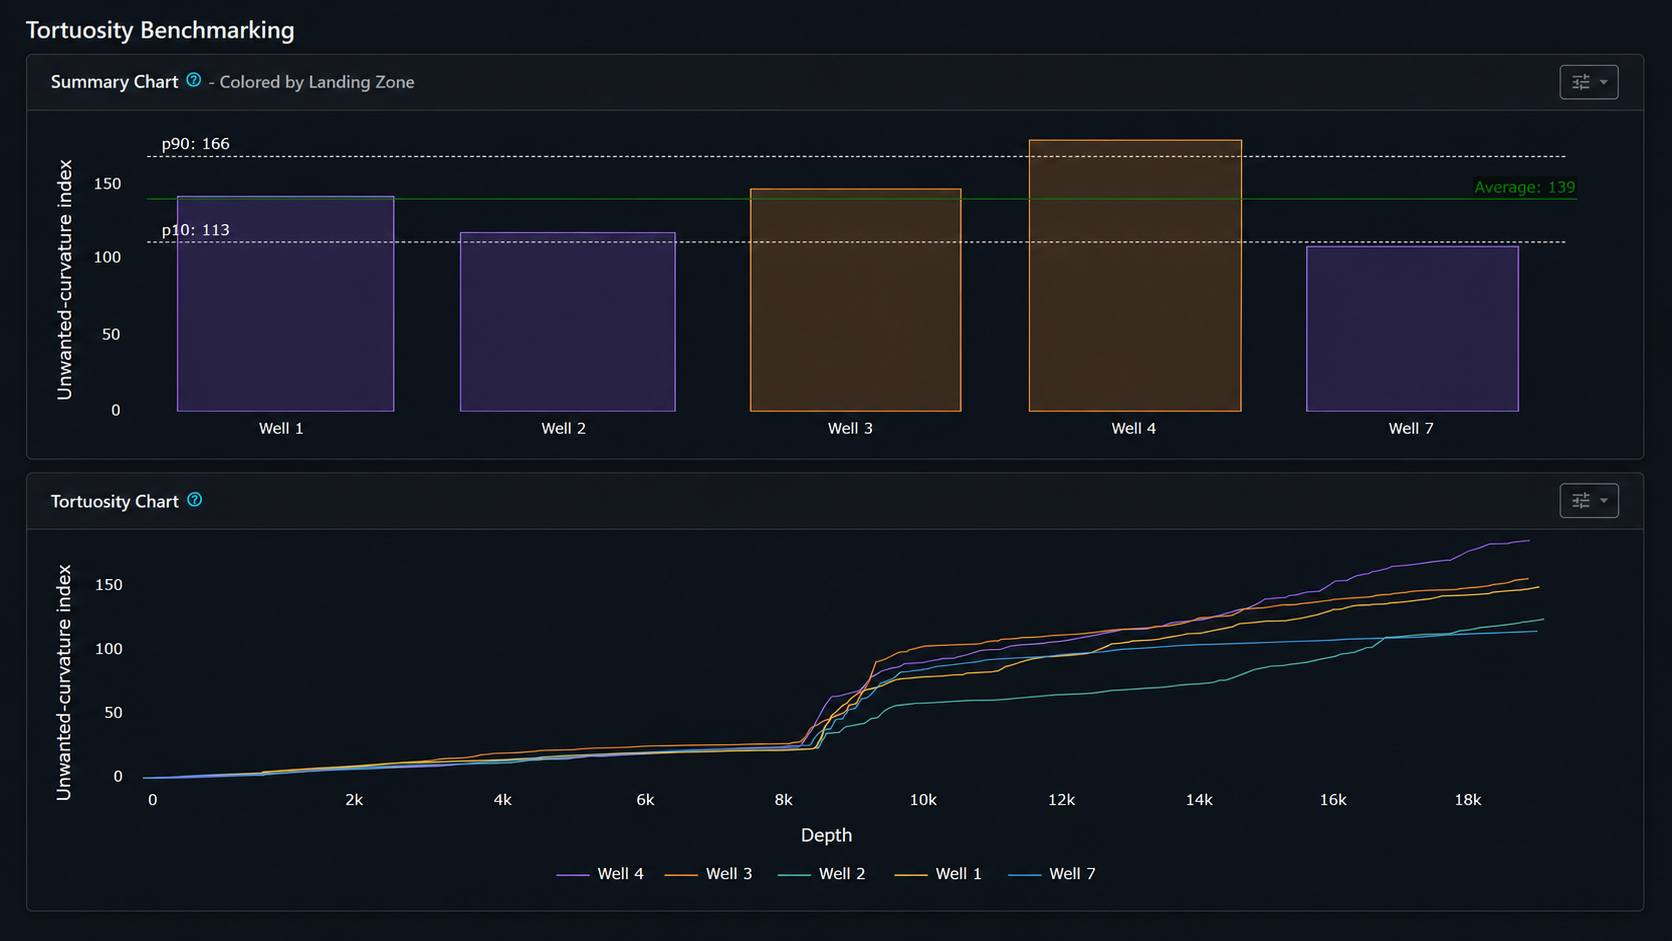
- Trajectory and tortuosity
Define a comparable directional response
Compare rotation-only stands using the same bit-to-sensor reference, survey basis, stand range, and BHA context. Depth trends and build-versus-walk crossplots show recurring assembly behavior without reducing it to one whole-run average.
- Filter by BHA, formation, and stand range.
- Quantify build and walk response on a consistent basis.
- Review stand-level trends and crossplots together.
Separate repeatable tendency from attribution
Compare response distributions across formation intervals and operating-parameter windows before attributing a change to the assembly. Survey spacing, steering history, rock, and operating inputs can produce similar patterns, so the dashboard supports diagnosis without claiming causation.