Probabilistic Reasoning for Drilling Dysfunction Detection
Stick-slip, whirl, bit bounce, balling, formation changes, and other drilling conditions can produce overlapping surface signatures. A useful surveillance system should represent competing explanations and uncertainty rather than force every observation into one deterministic diagnosis.
Suppose the following changes appear while rotary drilling:
- ROP decreases,
- MSE increases,
- torque becomes more variable,
- WOB remains approximately constant.
What dysfunction is occurring?
Possible answers include:
- stick-slip,
- whirl,
- bit bounce,
- bit balling,
- changing formation,
- deteriorating bit condition,
- poor hole cleaning.
Some of those explanations may require very different operational responses.
That is the difficulty.
A real-time drilling system usually does not observe the dysfunction itself.
It observes indirect evidence of the dysfunction.
The distinction is fundamental.
A downhole accelerometer may provide more direct evidence of vibration.
A surface drilling system usually sees:
- torque,
- WOB,
- RPM,
- ROP,
- differential pressure,
- flow,
- pressure,
- derived quantities such as MSE.
Those measurements are transmitted through:
- the drillstring,
- the wellbore,
- the mud motor,
- the control system,
- the formation.
By the time the behavior reaches the surface, several different downhole mechanisms may create similar signatures.
That makes dysfunction detection naturally uncertain.
A simplistic analytical architecture might still attempt:
If torque variability exceeds X, declare stick-slip.
or:
If MSE exceeds Y, declare inefficient drilling.
Those rules can sometimes be useful.
But they reduce a multidimensional mechanical problem to one hard boundary.
A more realistic question is:
Given everything we currently observe, how strongly does the evidence support each plausible drilling condition?
That is a probabilistic question.
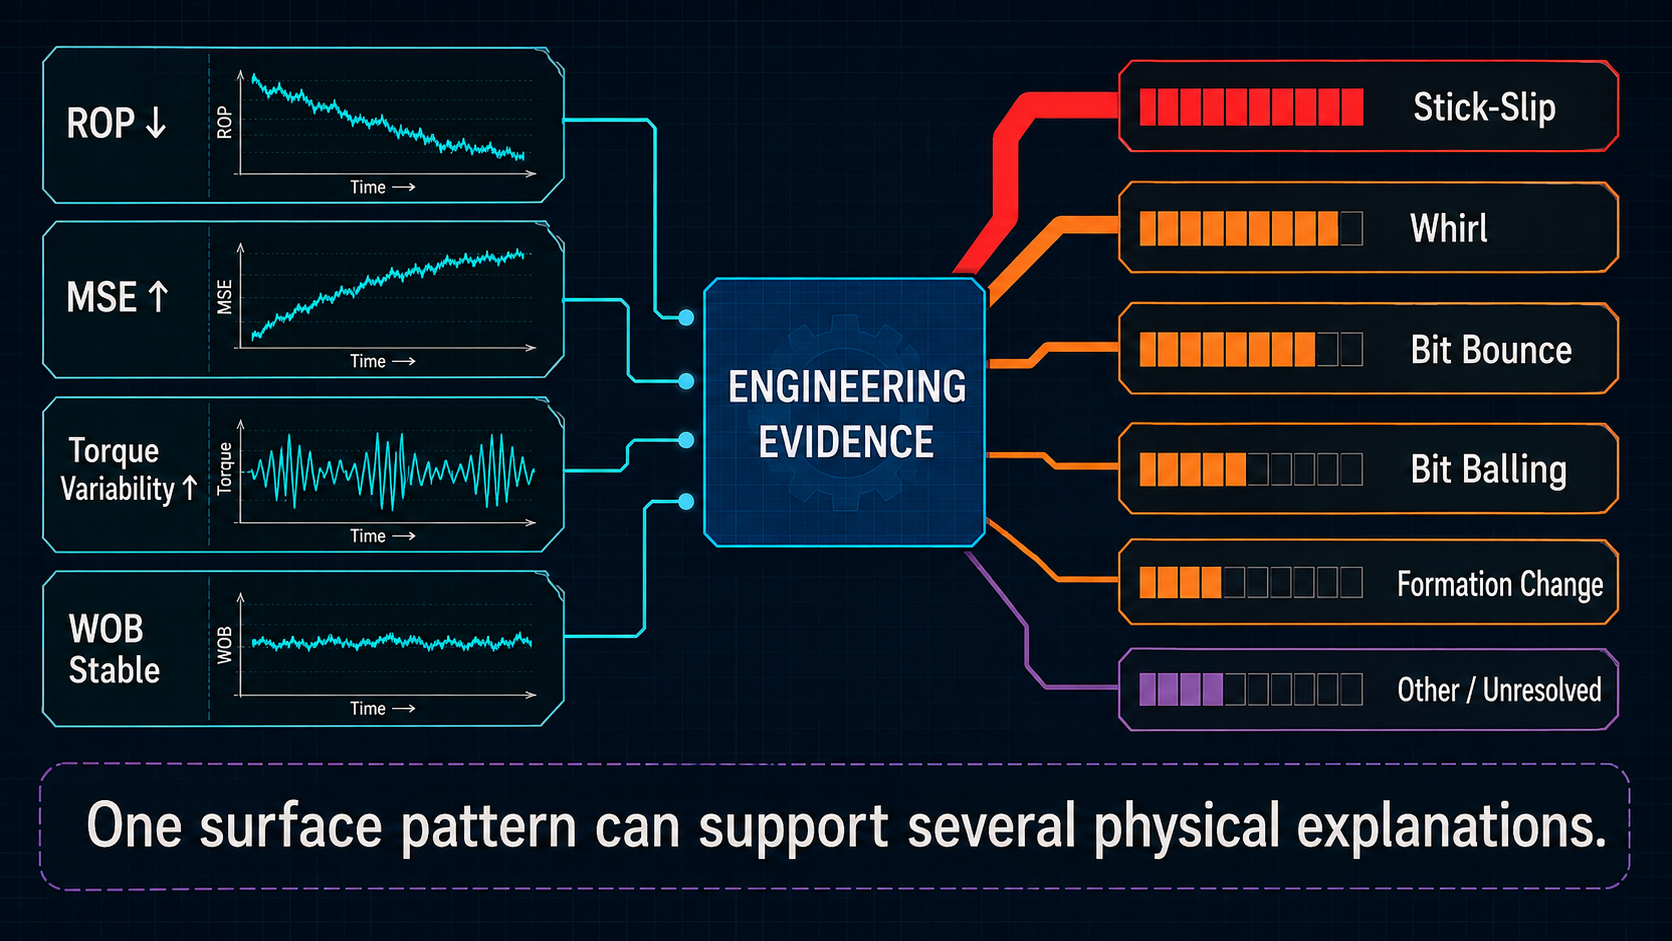
One surface pattern can support several plausible physical explanations.
Why Deterministic Rules Are Attractive
Hard rules are easy to understand.
For example:
$$x > threshold \Rightarrow Dysfunction$$
They are:
- transparent,
- computationally inexpensive,
- easy to test,
- easy to implement.
A threshold can be completely appropriate when a physical or equipment limit is genuinely hard.
Examples include:
- maximum pressure,
- maximum motor differential,
- equipment operating limit.
But dysfunction signatures are often not hard physical limits.
They are patterns.
And patterns are rarely perfectly separated.
Imagine Two Overlapping Populations
Suppose torque variability is generally:
Healthy drilling
lower.
Stick-slip
higher.
If the two populations never overlap, a threshold works perfectly.
Real drilling is rarely that clean.
Healthy drilling can occasionally produce large torque variation.
Stick-slip can begin gradually.
Formation changes can increase torque variability without severe torsional dysfunction.
The result may look conceptually like this:
$$P(x|Healthy)$$
overlapping with:
$$P(x|StickSlip)$$
Now a measured value near the overlap does not belong unquestionably to either state.
The best answer is not necessarily:
Healthy
or:
Stick-Slip.
The evidence may simply support one more strongly than the other.
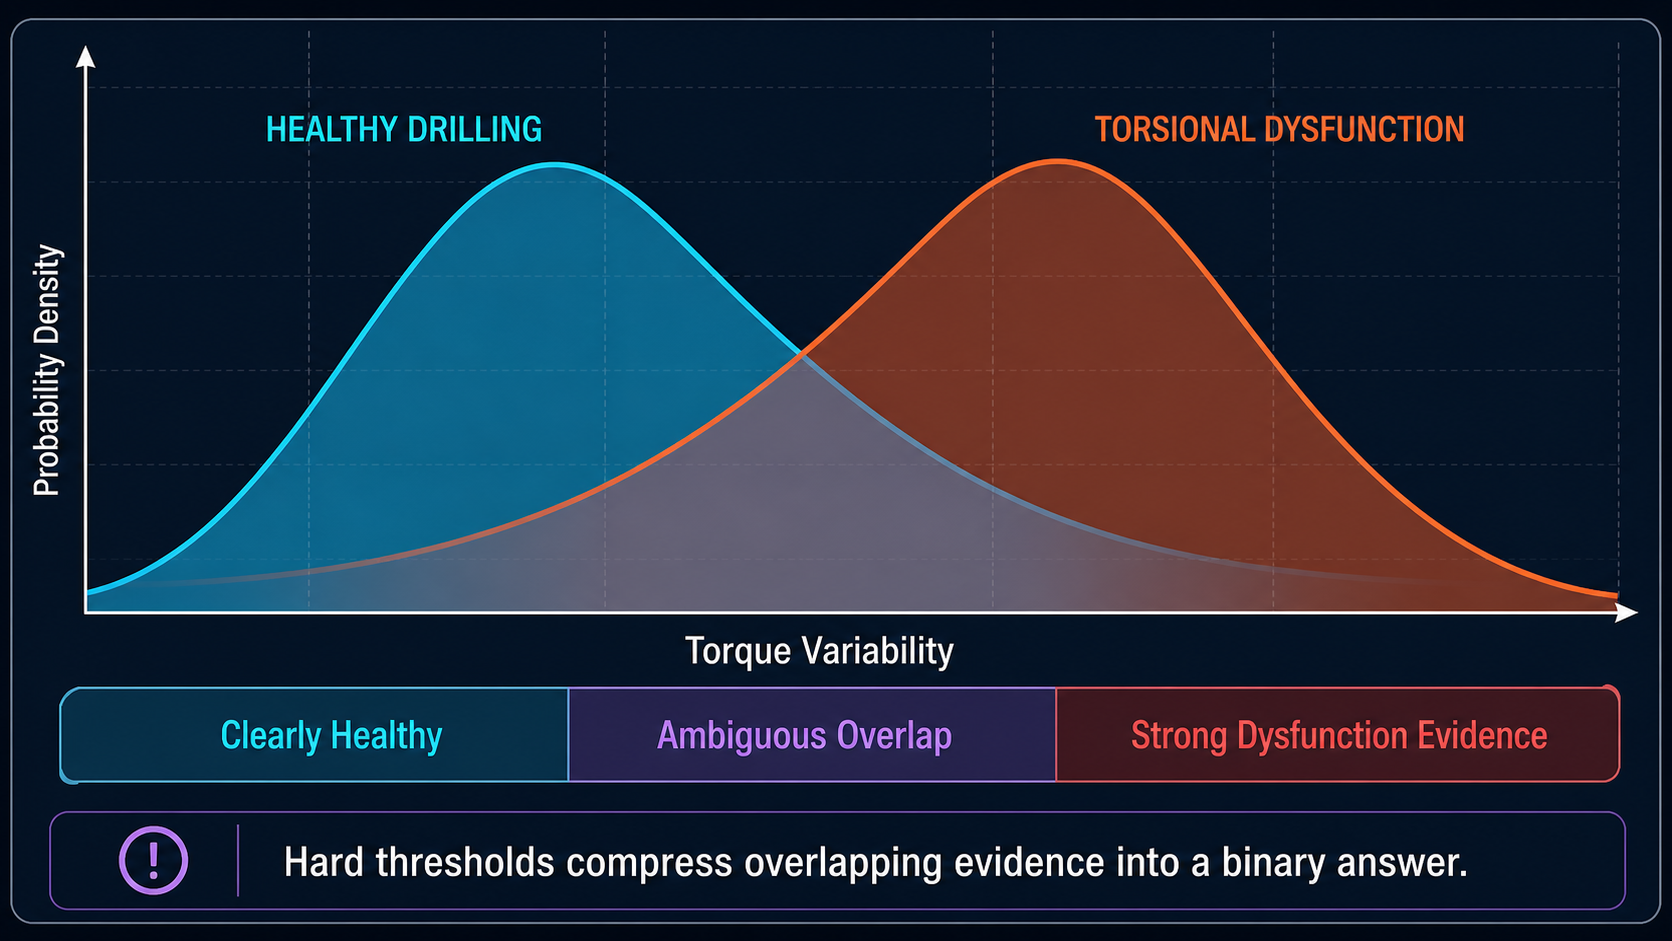
Overlapping signatures make binary thresholds a lossy representation of evidence.
Probability Represents Evidence, Not Direct Observation
Suppose an analytical model outputs:
Stick-slip probability = 0.65
What does that mean?
It does not mean:
The bit is physically experiencing 65% stick-slip.
The value represents the model's assessment of how the available evidence supports the hypothesis under its assumptions.
Conceptually, Bayesian reasoning can be written:
$$P(D|E) = \frac{P(E|D)P(D)} {P(E)}$$
where:
- $$D$$ = a possible dysfunction,
- $$E$$ = observed evidence.
In practical language:
Start with what was believed before the latest evidence, then update that belief based on how consistent the new evidence is with each possible condition.
That update is useful precisely because uncertainty is preserved.
Priors Matter
Suppose two dysfunctions produce similar surface signatures.
One is historically common in the current drilling configuration.
The other is rare.
Before seeing the latest measurement, the first condition may reasonably have a higher prior probability.
But priors should not overpower strong evidence.
If the observations become highly characteristic of the less common condition, the posterior belief should move.
This provides a useful compromise between:
historical expectation
and:
current-well evidence.
It also reveals a limitation.
Poorly chosen priors can bias the result.
Probability is not objective simply because it is expressed numerically.
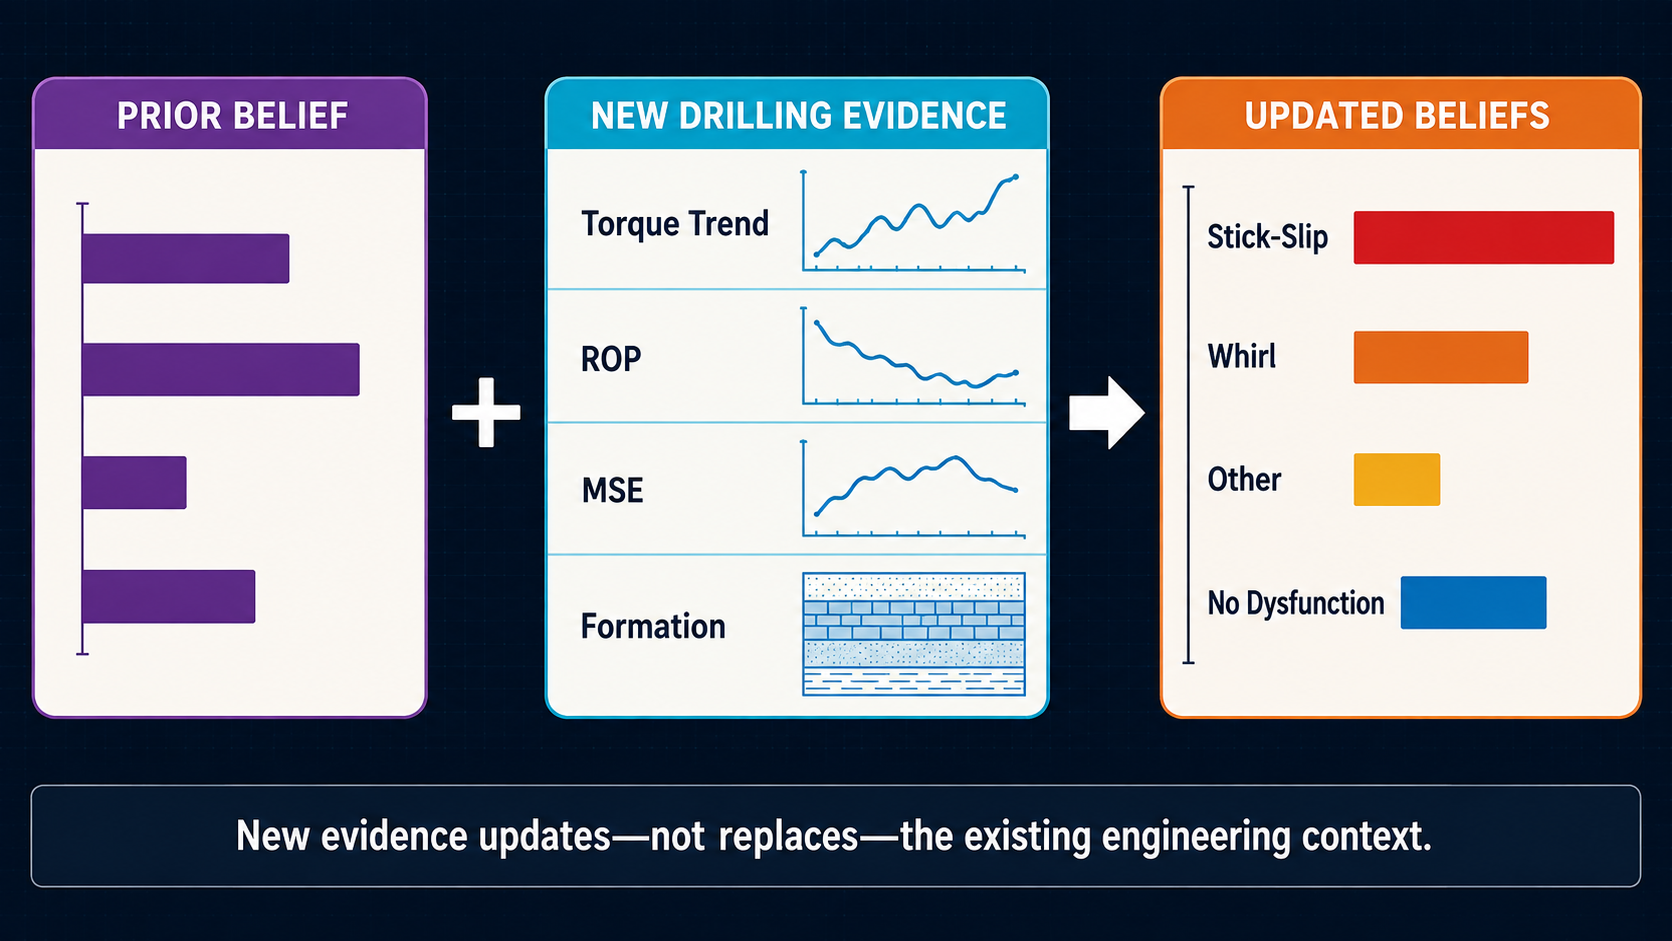
New evidence updates—not replaces—the existing engineering context.
The Current Rig State Changes the Meaning of Evidence
Suppose torque is high.
During:
rotary drilling
that may contribute to one set of interpretations.
During:
reaming
the expected mechanical response changes.
During:
connection
the signal may not be relevant to a drilling-dysfunction model at all.
Therefore:
$$P(D|E)$$
is incomplete without context.
A more realistic expression is:
$$P(D|E,C)$$
where $$C$$ includes context such as:
- rig state,
- drilling mode,
- formation,
- BHA,
- motor configuration.
This is why rig-state classification is foundational to dysfunction detection.
The analytical model should first understand:
what operation is occurring
before interpreting whether the measurements are abnormal for that operation.
Slide and Rotary Drilling Are Different Inference Problems
The earlier slide-versus-rotate article showed why these drilling modes should not automatically be pooled statistically.
Dysfunction detection has the same problem.
During rotary drilling, useful evidence may include:
- surface torque,
- surface RPM,
- ROP,
- WOB,
- MSE.
During slide drilling, interpretation increasingly depends on:
- motor behavior,
- differential pressure,
- toolface,
- BHA directional tendency,
- weight transfer.
A model that performs well for rotary drilling does not automatically become a valid slide-dysfunction detector.
The measurement context changed.
The mechanical system changed.
So the inference problem changed.
One KPI Rarely Contains Enough Information
Mechanical Specific Energy is an excellent example.
MSE may increase when drilling becomes inefficient.
But several dysfunctions can raise MSE.
So can:
- harder rock,
- poorer cleaning,
- bit wear.
Therefore:
$$High\ MSE \not\Rightarrow Specific\ Dysfunction$$
A better reasoning chain is:
$$High\ MSE \rightarrow Evidence\ of\ inefficiency$$
followed by:
$$Additional\ Evidence \rightarrow More\ specific\ interpretation$$
This is exactly why the MSE article treated the metric as a screening signal rather than a diagnosis.
Level and Movement Provide Different Evidence
Consider torque.
Current torque
18,000 ft-lbf
That tells us where the signal is now.
Torque progression
15,000
16,000
17,000
18,000
That tells us the signal is increasing.
Torque behavior
Rapidly fluctuating between:
12,000 and 24,000 ft-lbf
That tells us something different again.
A dysfunction model can therefore use both:
location
and:
movement.
Conceptually:
Location feature
Is the current value:
- low,
- normal,
- high?
Movement feature
Is the signal:
- increasing,
- decreasing,
- stable,
- erratic?
SPE-186166 uses this distinction explicitly in its public methodology.
That is a valuable general principle well beyond one particular model.
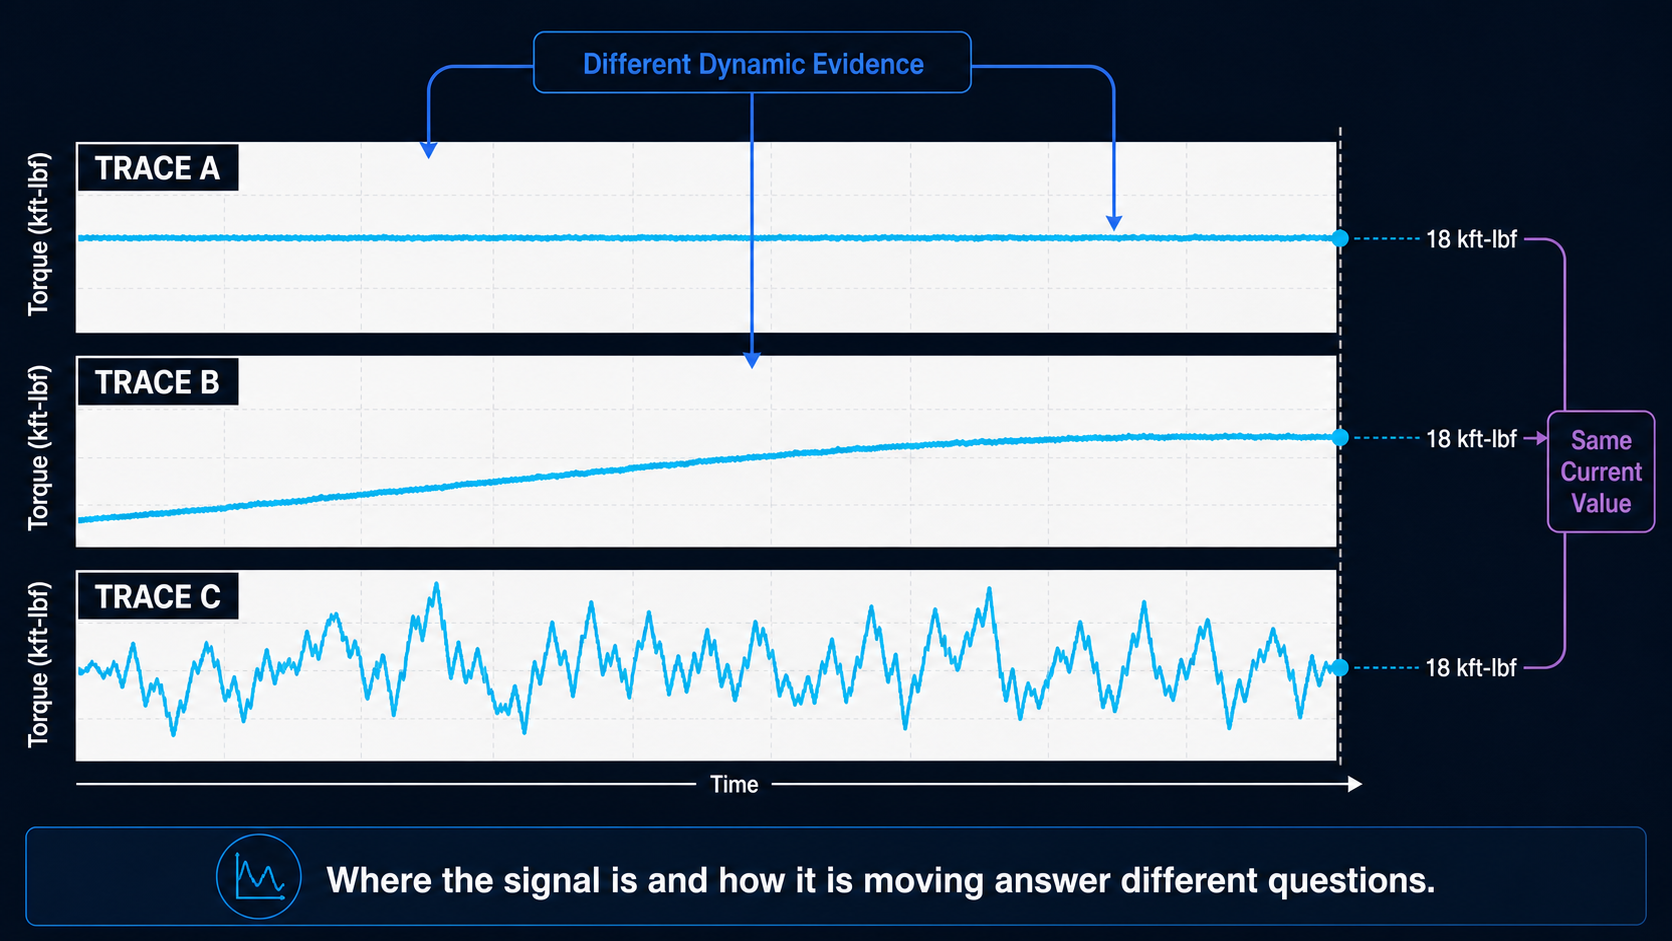
The current value and the path used to reach it provide different evidence.
A High Signal Can Be Normal
Suppose MSE is high.
If:
- formation strength also increased,
- offsets show the same response,
- torque behavior remains stable,
then high MSE may be expected.
Now suppose MSE becomes high while:
- formation context remains stable,
- torque becomes erratic,
- ROP deteriorates.
That provides different evidence.
Probabilistic reasoning becomes most valuable when it combines:
signal magnitude
with:
signal context.
Formation Context Can Prevent False Dysfunction Diagnosis
Drilling through a formation transition can cause:
- ROP change,
- torque change,
- MSE change.
If the analytical system ignores geology, it may interpret a perfectly real process change as mechanical dysfunction.
SPE-186166 explicitly incorporates rock-strength context so changes in MSE can be interpreted relative to formation behavior rather than independently.
This illustrates a broader lesson:
Adding context can reduce diagnostic ambiguity without adding another sensor.
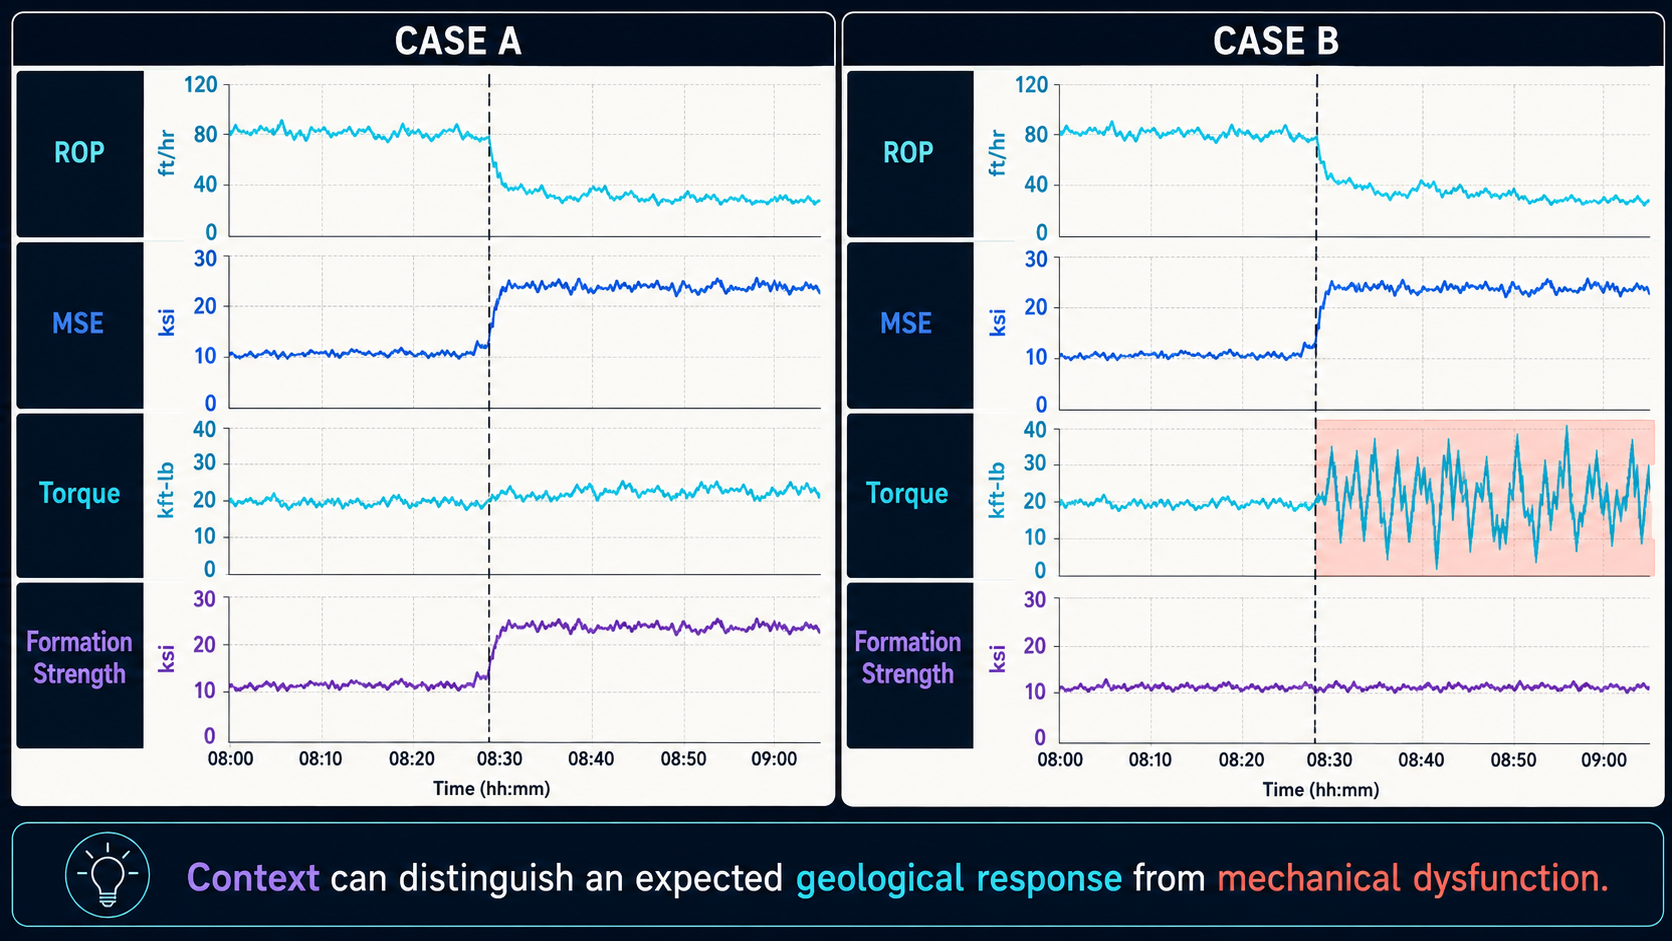
Formation context can separate an expected geological response from a mechanical anomaly.
Evidence Should Be Partially Independent
Suppose a model evaluates:
- ROP,
- MSE,
- DOC.
A reduction in ROP will:
- directly reduce ROP,
- tend to increase MSE,
- reduce DOC.
The model now sees three worsening features.
But all three contain the same underlying measurement.
That is not equivalent to three independent observations.
Likewise:
- torque,
- a torque-variability metric,
- a torque-derived stick-slip index
share information.
This does not mean derived features are useless.
It means their dependence should be understood.
A model can become overconfident if correlated evidence is implicitly treated as independent confirmation.
Stronger Diagnosis Comes from Different Physical Evidence
Consider suspected torsional dysfunction.
More useful corroboration may come from combining evidence that reflects different aspects of the system:
- torque dynamics,
- ROP response,
- MSE relative to formation,
- downhole vibration if available.
That is stronger than four different mathematical transformations of the same torque channel.
The best additional measurement is often the one that reduces ambiguity most.
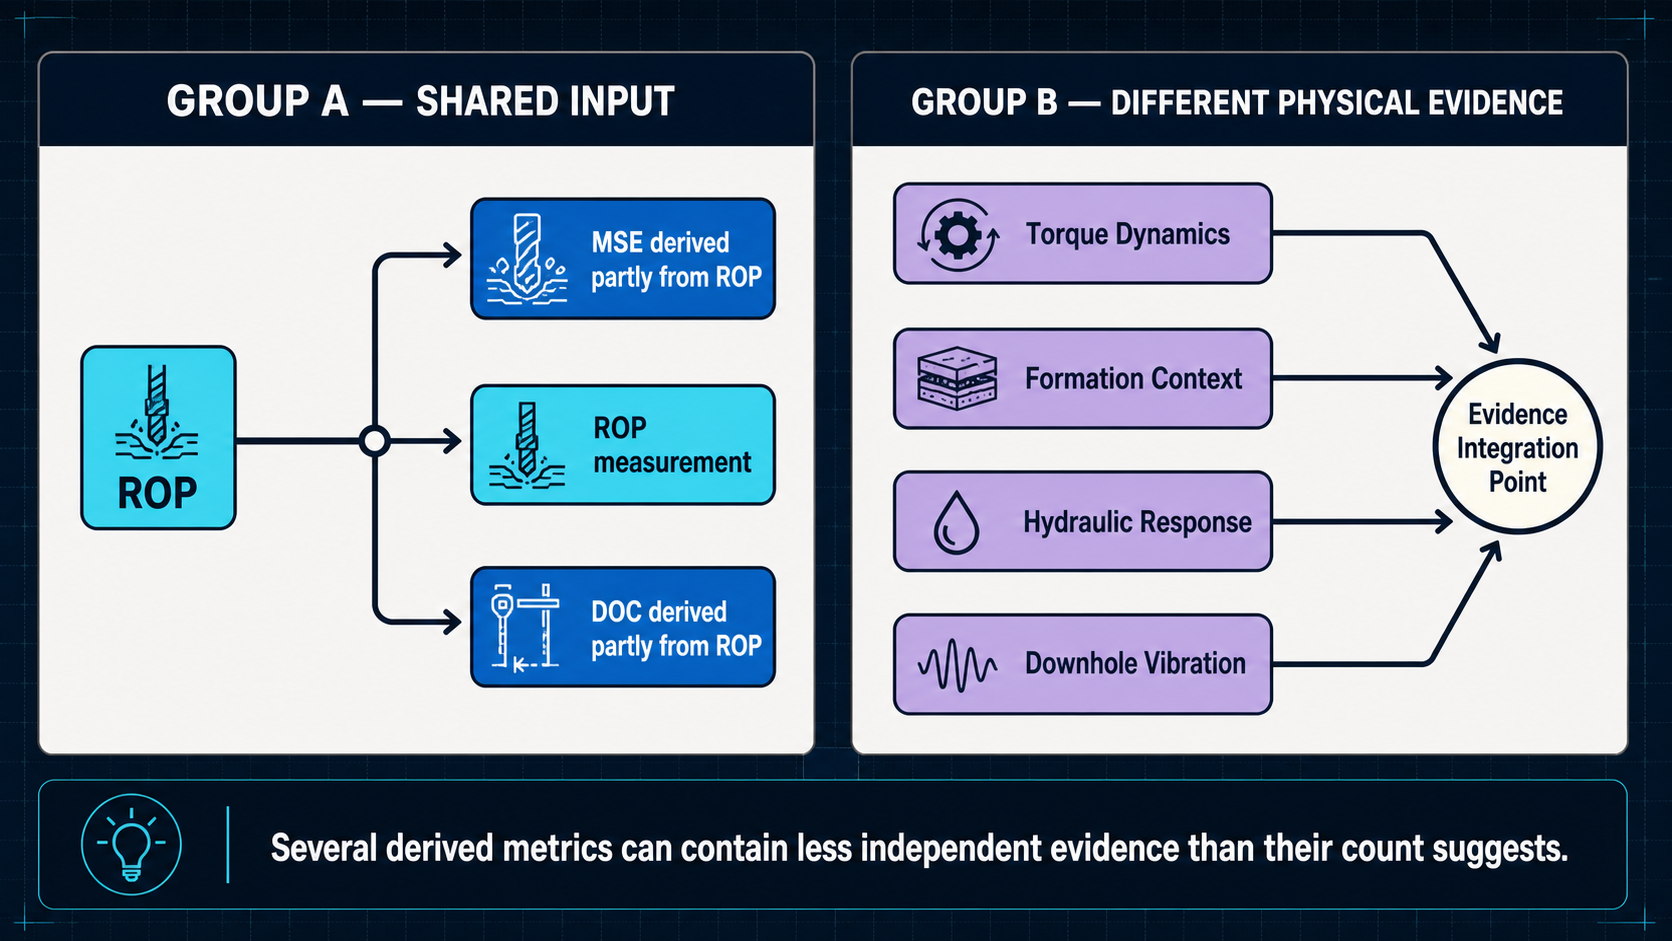
Several derived metrics can carry less independent evidence than their count suggests.
Missing Data Should Reduce Confidence
Suppose the dysfunction model normally uses five relevant features.
One disappears.
What should happen?
Not:
Assume the missing feature is normal.
And not:
Assume the missing feature is abnormal.
The evidence should become weaker.
This is one of the major advantages of explicit probabilistic reasoning.
Missing evidence can contribute:
less information
rather than forcing the model into an artificial state.
A Hydraulic Example Makes This Concrete
Washout and pump failure can share:
- pressure decrease,
- disagreement between modeled and measured pressure,
- similar trends in several hydraulic indicators.
Flow-out behavior provides important discriminating evidence.
If flow-out measurement disappears, the system may still have strong evidence that:
something is wrong in the circulating system.
But it loses some ability to distinguish:
washout
from:
pump failure.
The appropriate response is not to invent specificity.
It is to preserve the broader conclusion.
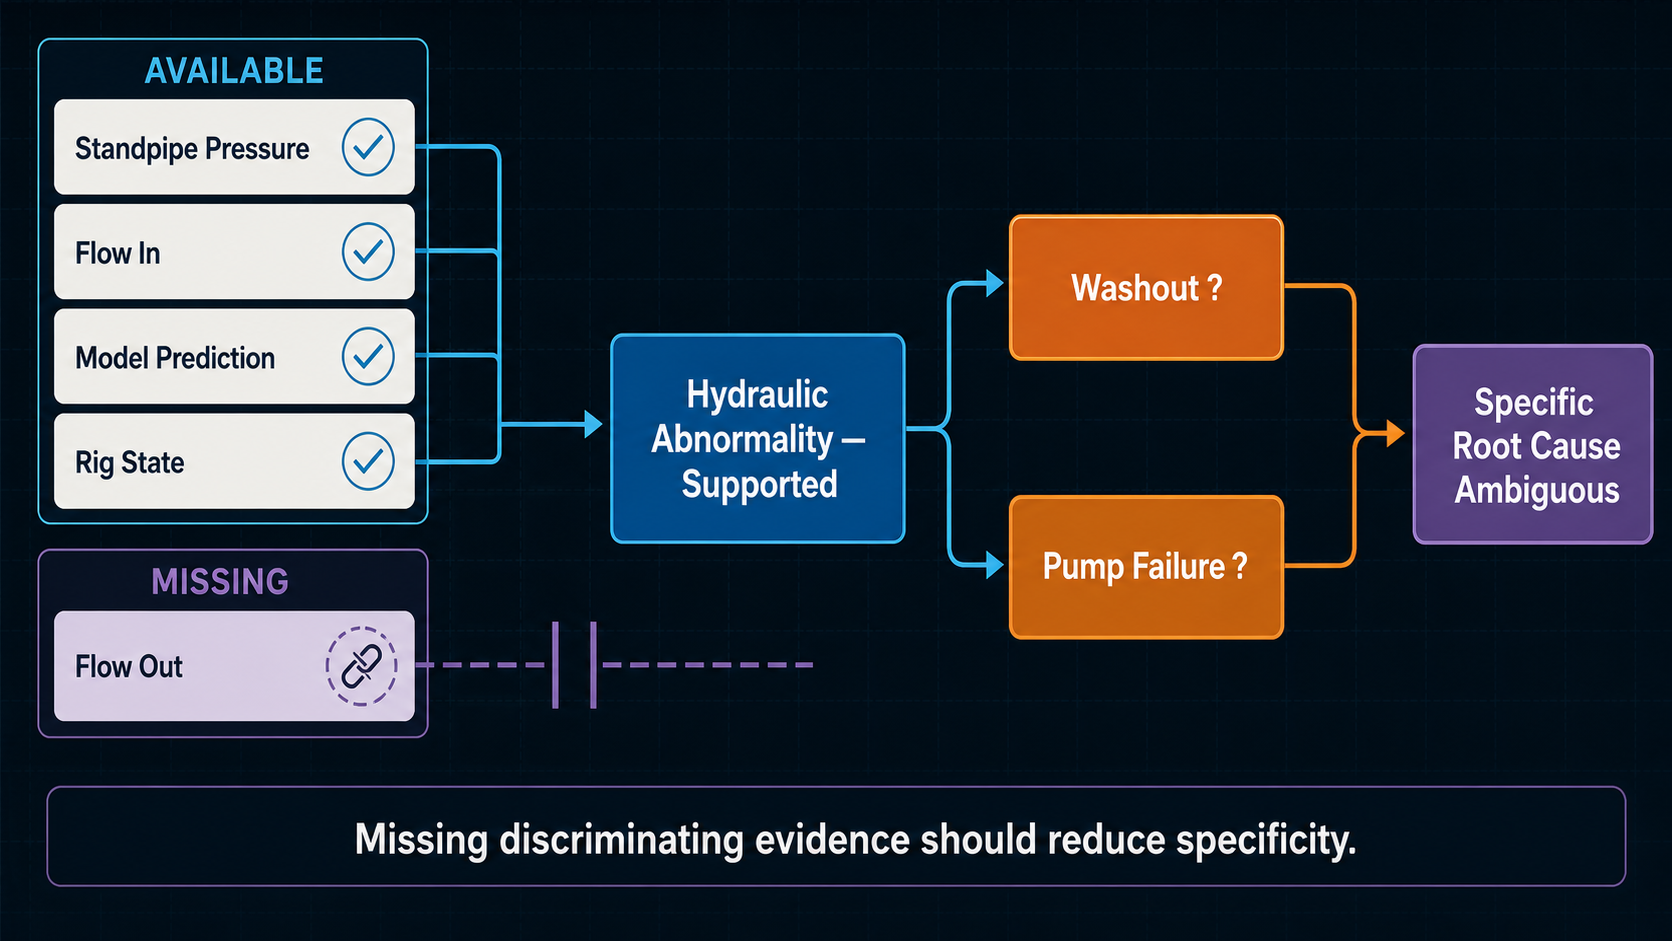
Missing discriminating evidence should reduce root-cause specificity.
Several Hypotheses Can Remain Plausible
Suppose a hypothetical rotary-drilling model produces:
- Stick-slip: 0.48
- Whirl: 0.31
- Bit bounce: 0.08
- Other: 0.07
- No dysfunction: 0.06
These values are purely illustrative.
Should the user see:
Stick-slip detected.
Maybe not.
A better interpretation may be:
Evidence currently favors torsional dysfunction, but whirl remains a meaningful competing explanation.
That communicates much more engineering information.
The probability distribution itself can contain useful ambiguity.
The Top Probability Is Not Automatically a Diagnosis
Consider:
Case A
Stick-slip:
0.90
Whirl:
0.04
Other:
0.03
No dysfunction:
0.03
Case B
Stick-slip:
0.36
Whirl:
0.34
Other:
0.20
No dysfunction:
0.10
In both cases:
stick-slip has the highest value.
The quality of that conclusion is clearly different.
Ranking first is not the same as being well separated from alternatives.
This is why interfaces should avoid turning:
largest probability
into:
confirmed root cause
without additional logic.
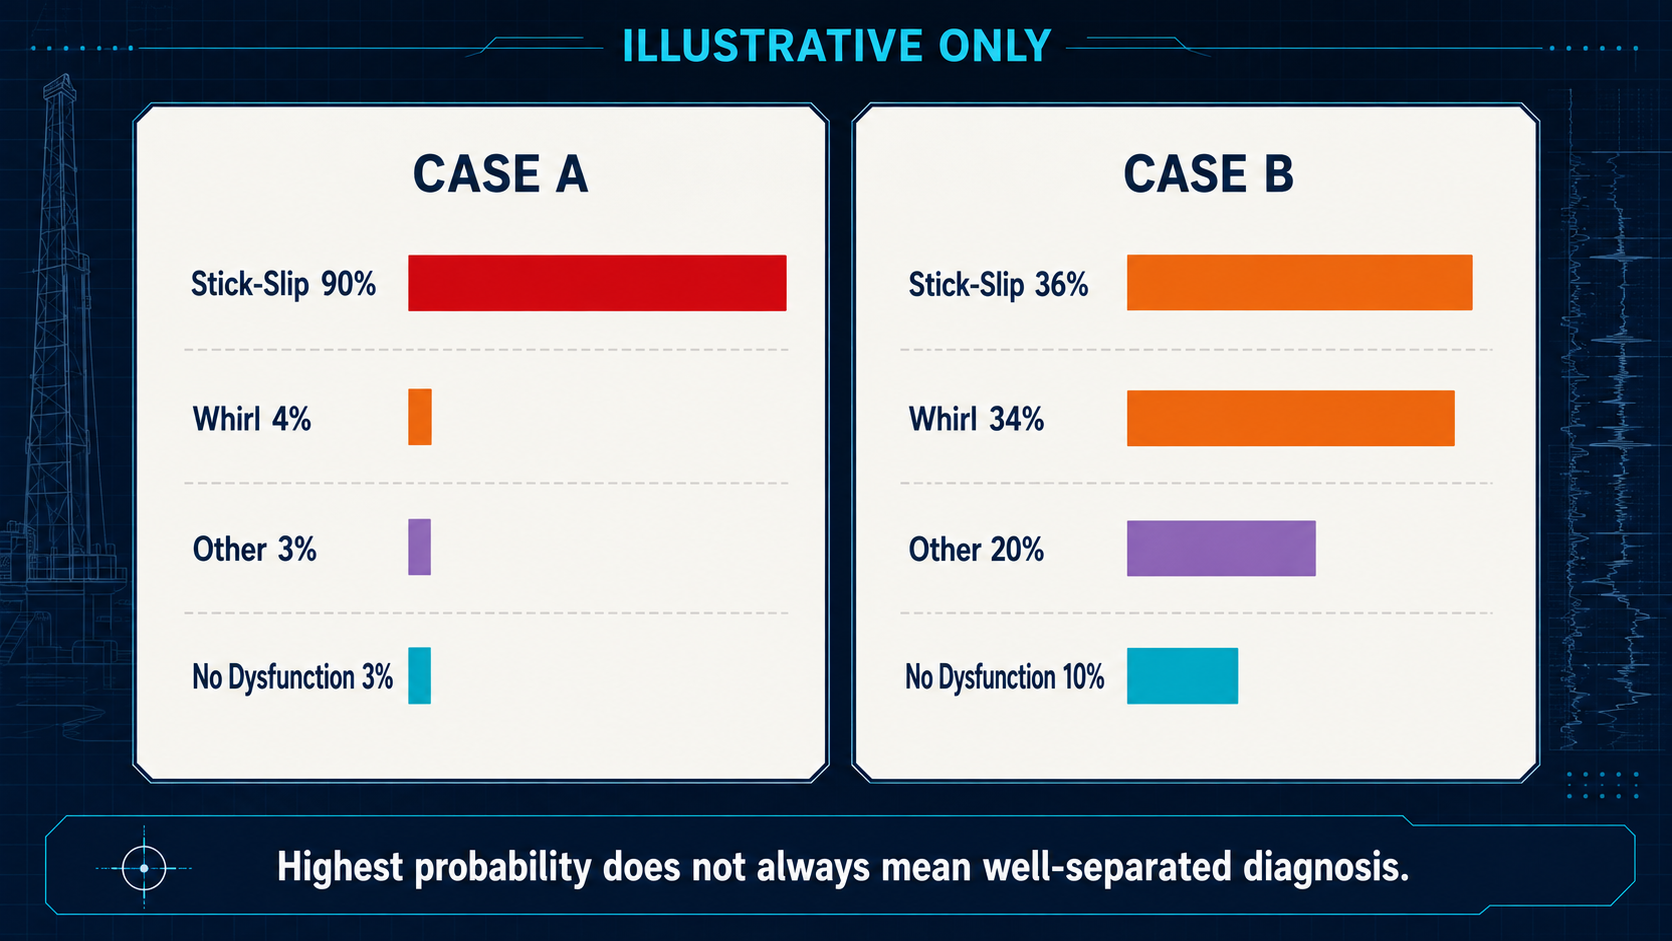
The highest-ranked hypothesis is not necessarily well separated from alternatives. Values are illustrative only.
Probability Needs Calibration
Suppose a model reports:
70% probability
for 100 historical cases.
If the model is well calibrated, approximately 70 of those cases should ultimately correspond to the target outcome—assuming reliable ground truth and a suitably defined evaluation population.
If instead only 30 do, the numerical probability is misleading.
Calibration therefore matters.
A confidence-looking number is useful only if historical outcomes support its interpretation.
This becomes difficult in drilling because ground truth itself is often imperfect.
Ground Truth May Be Uncertain
How was historical stick-slip labeled?
Possibilities include:
- downhole tool,
- surface torque pattern,
- driller interpretation,
- post-run damage,
- analyst review.
Those labels are not necessarily equivalent.
Whirl is an even clearer example.
Some downhole vibration states can be difficult to diagnose confidently from surface measurements alone.
So a dysfunction-training dataset may contain:
uncertain labels describing uncertain physical events.
Machine learning cannot eliminate that uncertainty.
It can only learn from the labels it receives.
Surface Data Can Establish the Dysfunction Family Without the Exact Location
Suppose torque behavior strongly indicates torsional oscillation.
Can surface data tell whether the dominant behavior occurs at:
- the bit,
- BHA,
- another portion of the string?
Not necessarily.
SPE-205844 notes a case where surface evidence indicated stick-slip occurring somewhere downhole but could not establish whether the bit or BHA itself was responsible without downhole data.
That distinction matters.
Torsional dysfunction is occurring
can be a defensible conclusion.
The bit is sticking every revolution
may not be.
Different Dysfunctions Can Coexist
Real drilling does not always respect our classifier categories.
A bit can experience:
- torsional dysfunction,
- coupled lateral behavior,
- changing formation
at the same time.
Similarly, a poor hydraulic condition can contribute to:
- bit balling,
- poor ROP,
- elevated MSE.
So a model architecture that forces every observation into exactly one mutually exclusive state may simplify reality too aggressively.
Sometimes the correct result is:
multiple mechanisms may be active.
Probabilistic systems make that possibility easier to represent—provided the model structure allows it.
The Corrective Action Raises the Stakes
Why does the distinction between stick-slip and whirl matter?
Because parameter changes used to mitigate one condition may not be appropriate for another.
The exact response remains dependent on:
- bit,
- BHA,
- formation,
- control system,
- operating limits.
But the broader point is important:
A wrong diagnosis can produce the wrong parameter direction.
That means dysfunction detection should not be optimized solely for producing a confident label.
It should be optimized for supporting a defensible operational decision.
Probability Should Delay Action When the Decision Is Sensitive
Suppose:
- stick-slip evidence is moderate,
- whirl evidence is nearly as strong,
- proposed mitigations point in different directions.
That is precisely when the system should be cautious.
Possible next step:
- inspect raw torque behavior,
- check formation context,
- evaluate additional downhole evidence,
- make a conservative parameter test.
In contrast, if all major evidence streams strongly support one condition, a more direct recommendation may be justified.
Decision confidence should therefore reflect:
diagnostic separation
as well as:
probability magnitude.
A Practical Example
Consider a hypothetical lateral.
Current rotary operation:
- WOB = 36 klbf,
- RPM = 110,
- ROP = 190 ft/hr.
Over the next two stands:
- ROP falls to 155 ft/hr,
- MSE rises,
- average torque increases modestly,
- torque variability rises substantially.
Evidence 1 — MSE
Supports:
drilling inefficiency.
Does not uniquely identify cause.
Evidence 2 — Torque variability
Supports:
torsional instability.
Evidence 3 — Formation
Gamma and offset behavior show no obvious formation transition.
That weakens:
formation change
as the primary explanation.
Evidence 4 — Hydraulics
Flow and differential pressure remain generally consistent.
That weakens some:
hydraulic / balling
interpretations.
The resulting evidence may favor:
stick-slip
over:
- formation,
- balling,
- ordinary variability.
But now assume no downhole vibration data is available.
The output should remain qualified:
Current surface evidence strongly supports a developing torsional dysfunction and is more consistent with stick-slip than the competing explanations evaluated. Exact downhole motion cannot be confirmed from the available surface data.
That is much stronger than:
Stick-slip detected.
The first statement communicates:
- evidence,
- comparison,
- remaining limitation.
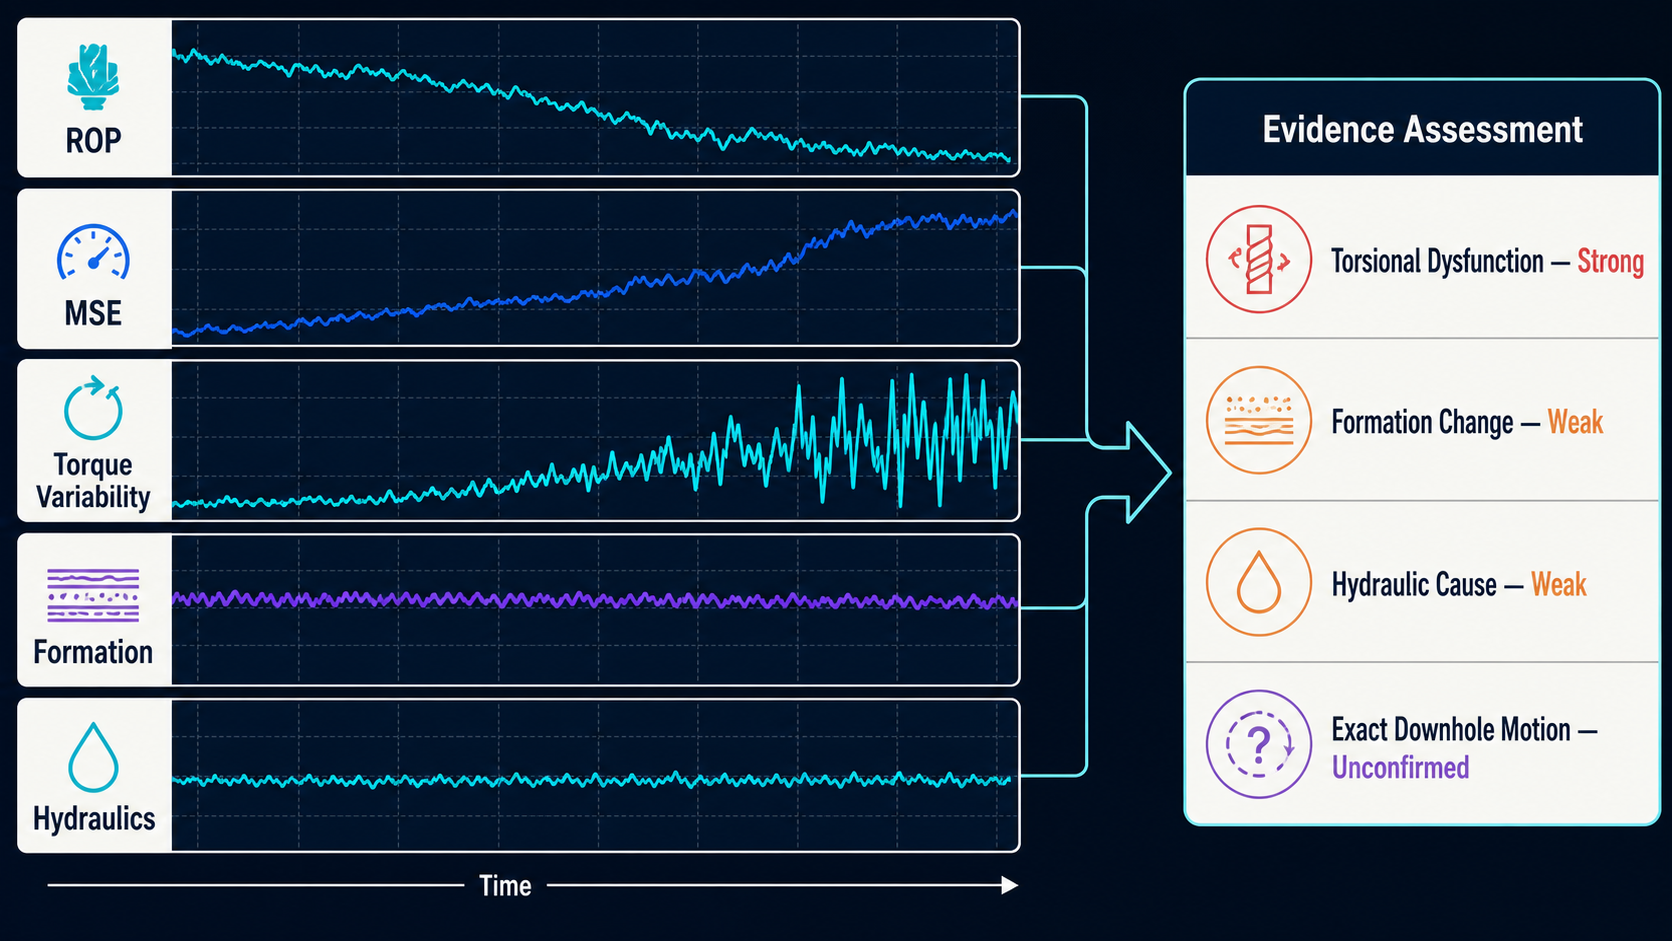
Synthetic evidence supports a developing torsional dysfunction while the exact downhole motion remains unconfirmed.
The Model Should Explain What Changed Its Belief
Suppose stick-slip belief increases.
The engineer should be able to ask:
Why?
A useful explanation might be:
- torque became more erratic,
- MSE moved above the expected formation-relative baseline,
- ROP declined,
- rig state remained rotary drilling.
That is much more valuable than:
AI confidence increased from 61% to 79%.
Explainability is especially important in probabilistic systems because otherwise probability can look like unexplained mathematical authority.
Do Not Show More Precision Than the Model Deserves
A display might report:
Stick-slip probability: 73.428%
The decimal places add almost no engineering value.
They may imply calibration precision that does not exist.
Often a better interface is:
- low evidence,
- moderate evidence,
- strong evidence,
or a rounded probability accompanied by the relevant evidence.
The numerical resolution of the software should not be confused with the epistemic resolution of the model.
Probabilities Are Model-Specific
A 0.8 dysfunction belief from one model is not automatically equivalent to:
0.8
from another.
They may use different:
- priors,
- feature definitions,
- training datasets,
- event labels,
- assumptions.
Therefore probabilistic outputs should not be compared across systems as though they were standardized physical units.
Probability is conditional on the model that produced it.
A Threshold Converts Probability Back Into a Decision
Eventually an operational system may need:
$$Alert = P(D) > T$$
Once that happens, the probabilistic model feeds a deterministic workflow.
That is appropriate.
But threshold selection should depend on:
- consequences of a missed event,
- cost of false alarms,
- required response,
- model calibration.
There is no universal probability threshold that makes all drilling alerts trustworthy.
Detection and Alerting Should Stay Separate
This is worth emphasizing.
Detection layer
Continuously estimates evidence for:
- stick-slip,
- whirl,
- other conditions.
Alert layer
Decides whether:
- evidence is strong enough,
- persistent enough,
- operationally important enough
to interrupt someone.
Those are different decisions.
A dysfunction probability can fluctuate continuously without generating an alarm every time it moves.
This connects directly to the earlier article on event detection versus continuous optimization.
A Better Dysfunction-Surveillance Workflow
A defensible workflow might look like this.
1. Identify the operating state
Separate:
- rotary,
- slide,
- reaming,
- other activity.
2. Validate the data
Check:
- missing channels,
- obvious faults,
- stale measurements.
3. Calculate engineering context
Examples:
- MSE,
- DOC,
- formation-relative baseline,
- hydraulic residuals.
4. Extract multiple evidence types
Evaluate:
- current level,
- trend,
- variability,
- persistence.
5. Maintain competing hypotheses
Examples:
- stick-slip,
- whirl,
- bit bounce,
- formation change,
- hydraulic issue,
- normal drilling.
6. Update evidence probabilistically
Allow each new measurement to:
- strengthen,
- weaken,
- leave unchanged
the support for each explanation.
7. Represent missing evidence explicitly
Do not substitute:
normal
for:
unknown.
8. Evaluate diagnostic separation
Ask:
Is one explanation substantially better supported than the alternatives?
9. Show supporting evidence
Do not surface only a probability.
10. Recommend action only at appropriate confidence
Especially when competing diagnoses imply materially different actions.
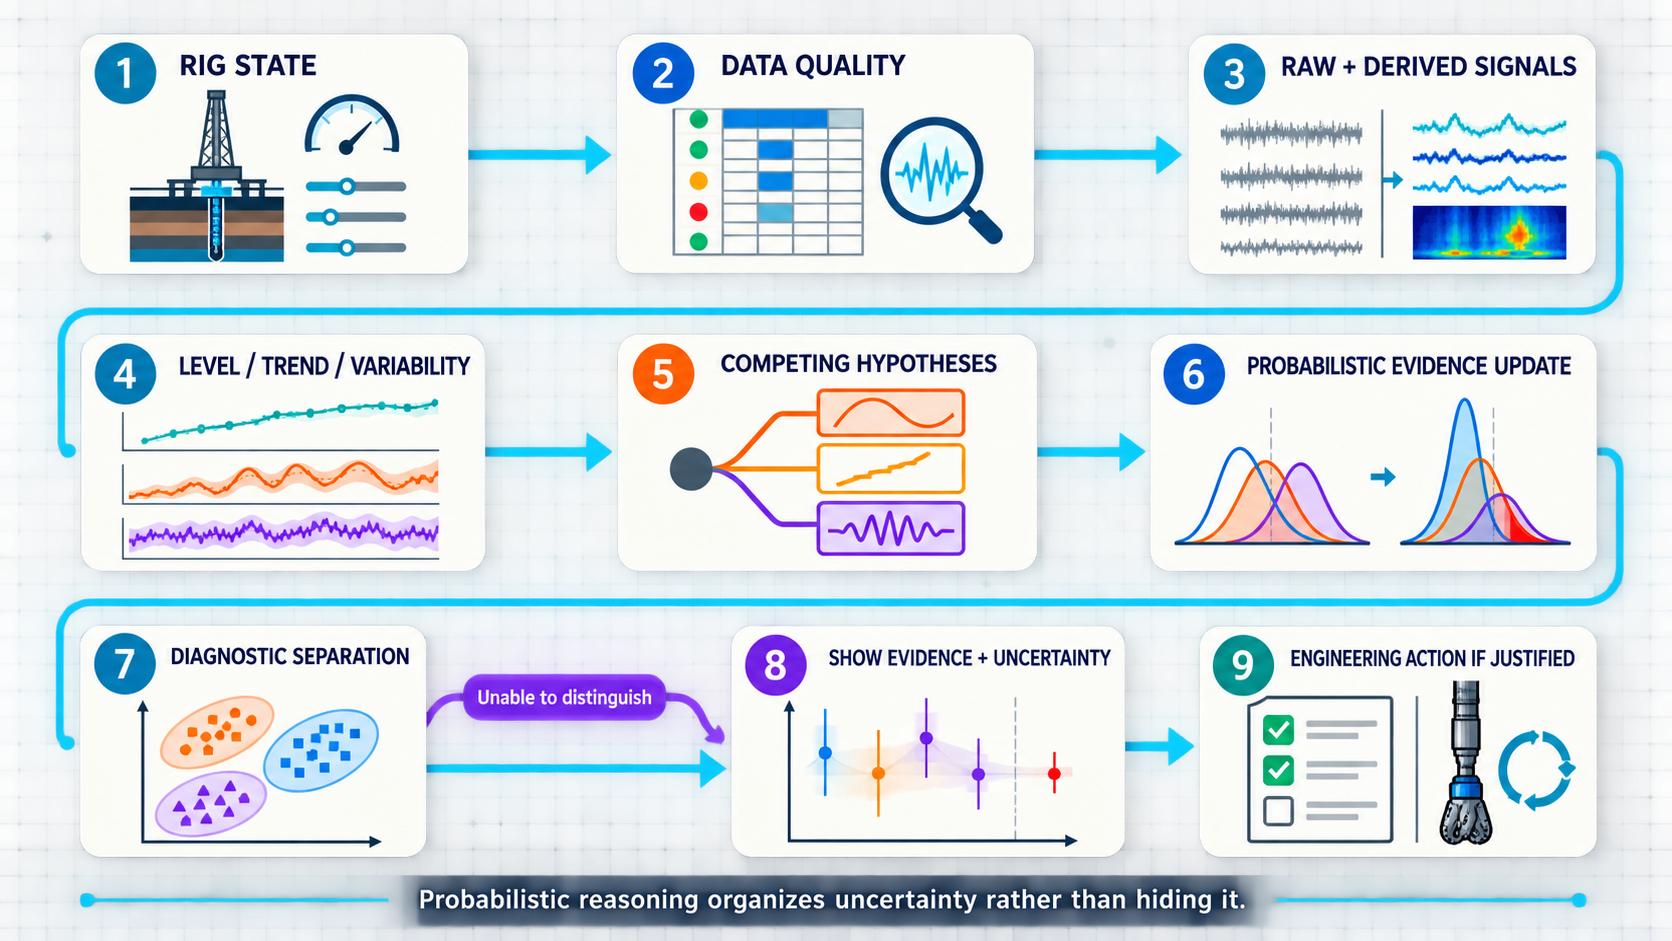
Probabilistic reasoning organizes uncertainty rather than hiding it.
What Probabilistic Detection Is Good At
It is especially useful when:
Several causes share symptoms
One signal cannot identify the root cause.
Evidence arrives incrementally
Beliefs can update as the event develops.
Some inputs are unavailable
Missing evidence can reduce confidence without forcing a false state.
Context changes interpretation
Rig state, formation, and BHA can modify how evidence should be weighted.
Outputs need to remain uncertain
Several explanations can remain plausible simultaneously.
What It Does Not Solve Automatically
Probability does not remove:
Bad sensors
Bad inputs still corrupt inference.
Bad labels
A trained model cannot create better ground truth than the dataset provides.
Missing physical variables
Surface data cannot always resolve downhole mechanics uniquely.
Poor model structure
If the real event is not represented, the model may assign probability among the wrong alternatives.
Human interpretation
A probability does not determine whether the operational consequence justifies intervention.
A Real Synchronized Dysfunction Interval
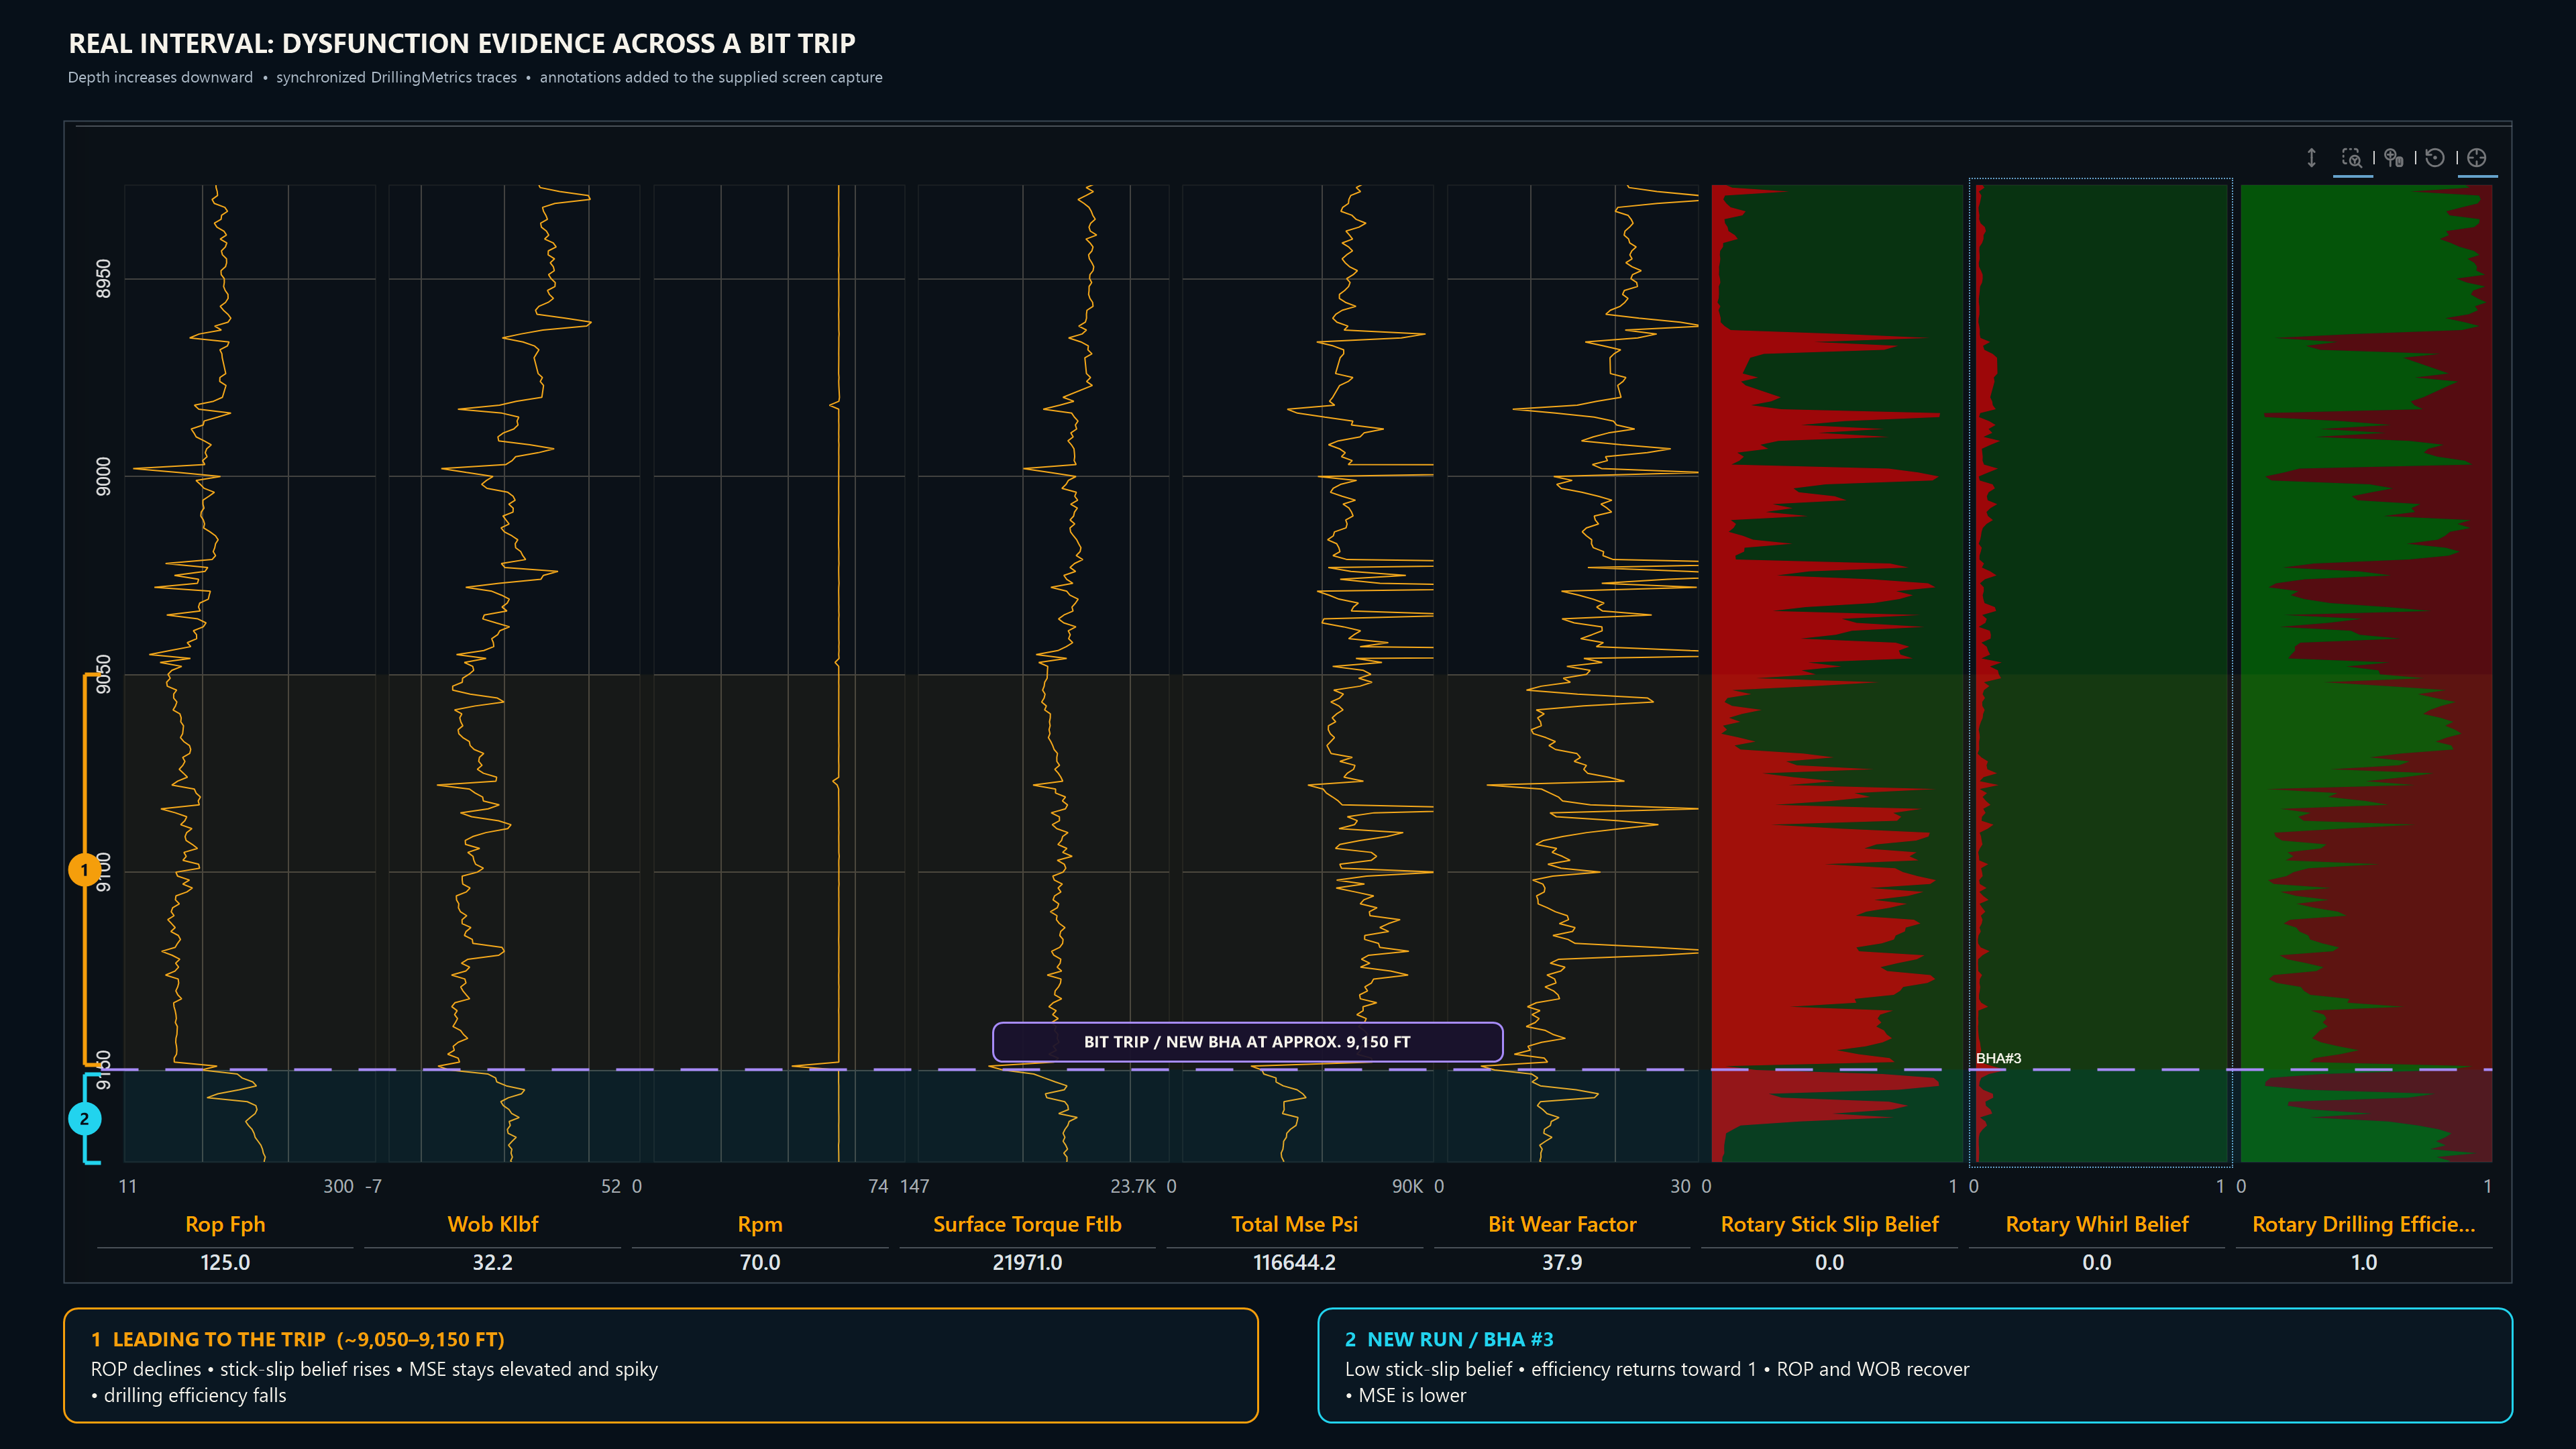
Real DrillingMetrics interval comparing the deteriorating pre-trip evidence pattern with the shorter BHA #3 recovery interval. Depth increases downward.
Leading to the bit trip near 9,150 ft, the synchronized traces show ROP declining, MSE remaining elevated and spiky, rotary stick-slip belief increasing, and rotary drilling efficiency falling.
On the new BHA #3 run, rotary stick-slip belief remains low, drilling efficiency returns closer to 1, ROP and WOB recover, and MSE is lower.
The value of the figure is not the belief track by itself. It is the reader's ability to see which measured and derived evidence changed with that belief.
The Most Important Output May Be the Distribution, Not the Winner
A deterministic classifier tends to answer:
Stick-slip.
A probabilistic system can answer:
Stick-slip is currently best supported, but whirl remains plausible and available surface evidence does not fully resolve the downhole mechanism.
The second answer contains more information.
That additional uncertainty is not noise around the result.
It is part of the result.
Conclusion
Drilling dysfunction detection is inherently an inference problem.
The rig does not usually observe:
stick-slip
or:
whirl
directly.
It observes:
- torque,
- WOB,
- RPM,
- ROP,
- pressure,
- flow,
- derived mechanical quantities.
Those measurements support hypotheses about what is occurring downhole.
Because the signatures overlap, the relationship is rarely:
$$One\ Symptom \rightarrow One\ Dysfunction$$
It is closer to:
$$Multiple\ Imperfect\ Signals + Engineering\ Context \rightarrow Competing\ Explanations$$
Probabilistic reasoning provides a disciplined way to handle that problem.
It allows:
- evidence to accumulate,
- competing explanations to coexist,
- missing information to reduce confidence,
- geological and operational context to modify interpretation.
But the probability itself is not the engineering conclusion.
The useful output still needs to communicate:
- what evidence was observed,
- which explanations it supports,
- what remains uncertain,
- whether the distinction is strong enough to justify action.
That is the real advantage of probabilistic dysfunction detection.
It does not make uncertain drilling mechanics certain.
It makes the uncertainty explicit enough to reason about.
References
-
Ambrus, A., Ashok, P., Chintapalli, A., Ramos, D., Behounek, M., Thetford, T. S., and Nelson, B. A Novel Probabilistic Rig Based Drilling Optimization Index to Improve Drilling Performance. SPE-186166-MS, SPE Offshore Europe Conference & Exhibition, Aberdeen, United Kingdom, 2017.
-
Ambrus, A., Ashok, P., Thetford, T., Behounek, M., and collaborators. Real-Time Detection of Drillstring Washouts and Mud-Pump Failures. IADC/SPE-189700-MS, 2018.
-
Ashok, P., Ambrus, A., Ramos, D., Lutteringer, J., Behounek, M., Yang, Y. L., Thetford, T., and Weaver, T. A Step by Step Approach to Improving Data Quality in Drilling Operations: Field Trials in North America. SPE-181076-MS, SPE Intelligent Energy International Conference and Exhibition, Aberdeen, Scotland, 2016.
-
Witt-Doerring, Y., Pastusek, P. P., Ashok, P., and van Oort, E. Quantifying PDC Bit Wear in Real-Time and Establishing an Effective Bit Pull Criterion Using Surface Sensors. SPE-205844-MS, SPE Annual Technical Conference and Exhibition, 2021.