Interpreting Surface WOB, RPM, and Torque in the Context of Downhole Conditions
Surface measurements are essential for real-time drilling surveillance, but WOB, RPM, and torque measured or inferred at the rig floor do not always describe the mechanical conditions acting at the bit.
The driller sees:
- WOB = 35 klbf
- surface RPM = 120
- surface torque = 18,000 ft-lbf
Those numbers are real measurements or rig-derived values.
But what is happening at the bit?
Is the bit actually seeing 35 klbf?
Is it rotating at 120 RPM?
Is 18,000 ft-lbf being applied to the rock?
In some drilling conditions, those may be reasonable approximations.
In others, they may not be.
This distinction becomes increasingly important in:
- deviated wells,
- long laterals,
- motor assemblies,
- slide drilling,
- high-friction wellbores,
- tortuous trajectories.
The issue is not that surface measurements are poor.
Quite the opposite.
Surface measurements are valuable precisely because they are:
- continuous,
- inexpensive,
- high frequency,
- available across almost every well.
The problem arises when a surface boundary measurement is interpreted as though it were a direct measurement at the bit.
Published drilling research provides several useful examples.
SPE-205844 used surface WOB in a PDC wear analysis, but explicitly described equality between surface WOB and bit WOB as a broad assumption during rotary drilling. Sliding intervals were excluded partly because high surface WOB was not considered a reliable indication of formation hardness under those conditions.[1]
SPE/IADC-214608 later incorporated a ratio between modeled torque at the bit and surface torque into a bit-degradation metric specifically because, in horizontal sections, torque available at the bit can be lower than the torque measured at surface.[2]
And SPE-186166 notes that when a downhole motor is present, effective bit RPM and motor-generated torque can be used in place of the corresponding surface quantities for MSE calculations.[3]
Together, these examples illustrate a broader engineering principle:
Surface measurements tell us what the drilling system is doing at the surface. Physics and context determine how much of that behavior reaches the bit.
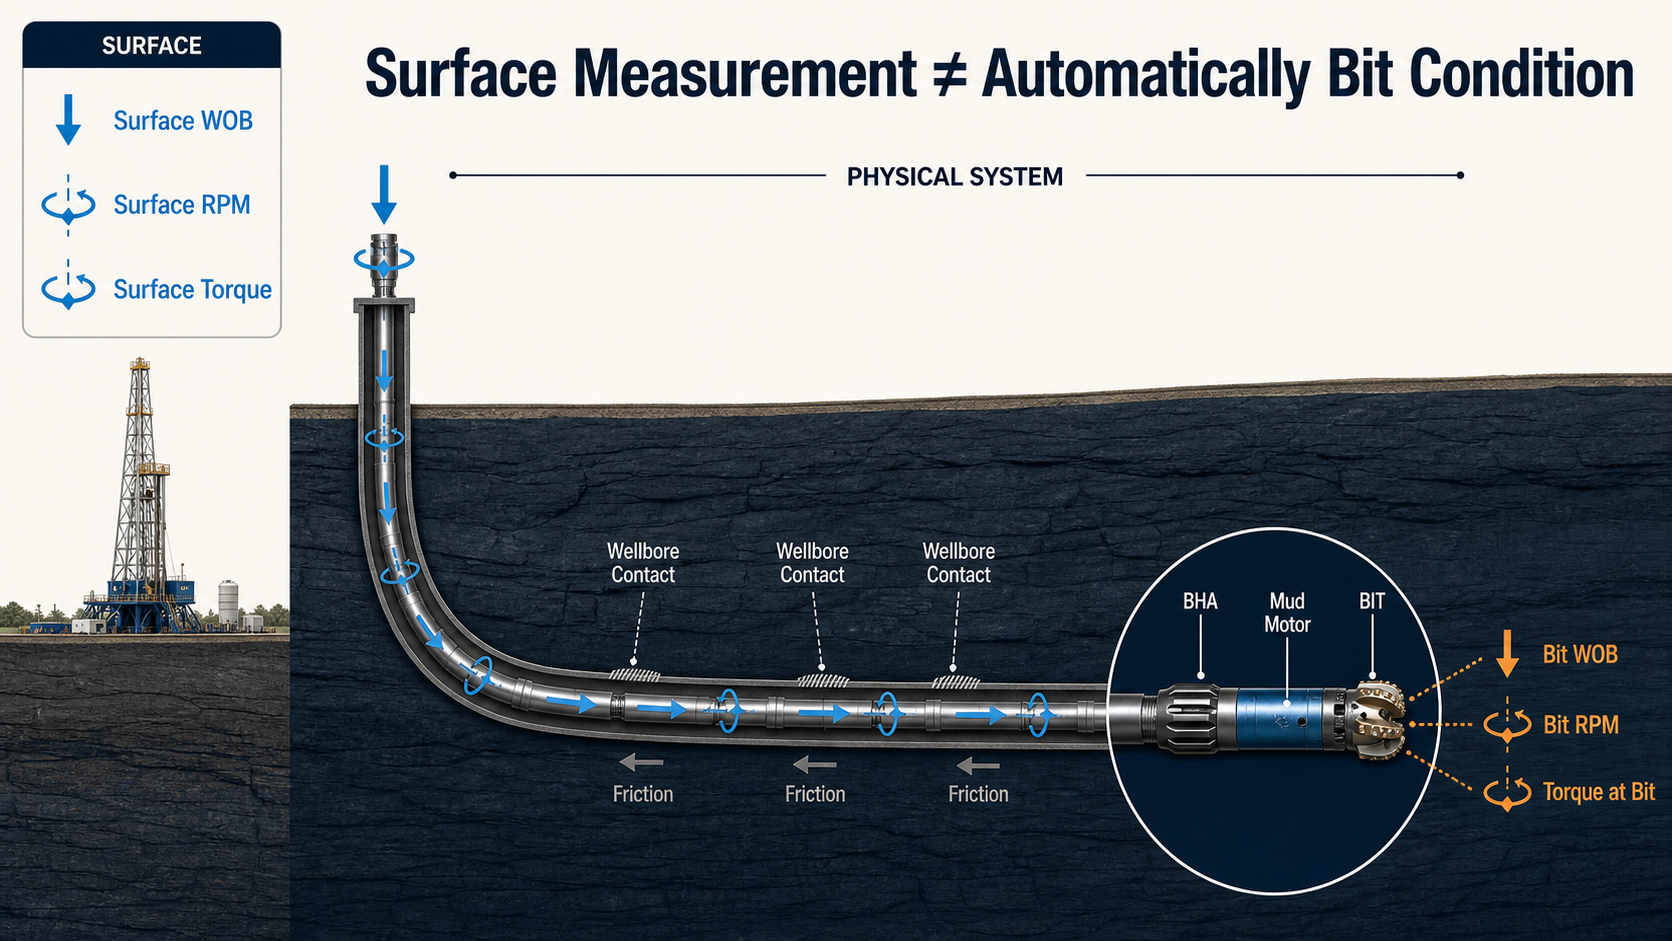
Surface measurements describe the surface operating state; drillstring, BHA, motor, and wellbore mechanics determine how those inputs should be interpreted at the bit.
Surface Data Is a Boundary Measurement
Consider surface torque.
The top drive measures the torque required to rotate the system from surface.
Part of that torque is associated with the bit cutting rock.
But part can also be required to overcome resistance elsewhere along the drillstring.
The same principle applies to axial force.
The rig measures the mechanical response of the suspended drillstring at surface.
The bit experiences the force that remains after mechanical interaction along the string.
A torque-and-drag model represents this by calculating axial force and torque progressively through the drillstring while accounting for quantities such as:
- buoyant pipe weight,
- trajectory,
- curvature,
- contact force,
- friction.
SPE-191426 describes a 3D soft-string torque-and-drag model that calculates axial force and torque along individual drillstring elements using trajectory and friction information.[4]
The important conceptual point is:
$$Surface\ Condition \rightarrow Drillstring \rightarrow Wellbore\ Interaction \rightarrow Bit\ Condition$$
The drillstring is not an ideal rigid shaft transmitting every applied force without loss or redistribution.
That is particularly important as well geometry becomes more complex.
Vertical Wells Are Mechanically Simpler
In a relatively vertical hole, much of the drillstring weight acts in the axial direction.
Contact between the drillstring and wellbore can be comparatively limited.
Under those conditions, using surface quantities as approximations for downhole quantities can be reasonable for many analyses.
That does not make them exact.
It means the mechanical transformation between surface and bit is often less severe.
Now consider a 90° lateral.
A substantial length of drillstring is lying against the low side of the hole.
Mechanical interaction now depends strongly on:
- normal contact force,
- friction,
- trajectory,
- tortuosity,
- pipe movement,
- rotation.
The distinction between surface torque and bit torque becomes more important.
SPE/IADC-214608 explicitly addressed this in its bit-degradation calculation. The authors introduced a torque-on-bit ratio to account for horizontal sections where modeled torque at the bit was expected to be lower than surface torque.[2]
That correction was considered unnecessary for the vertical section in their implementation but important in lateral applications.
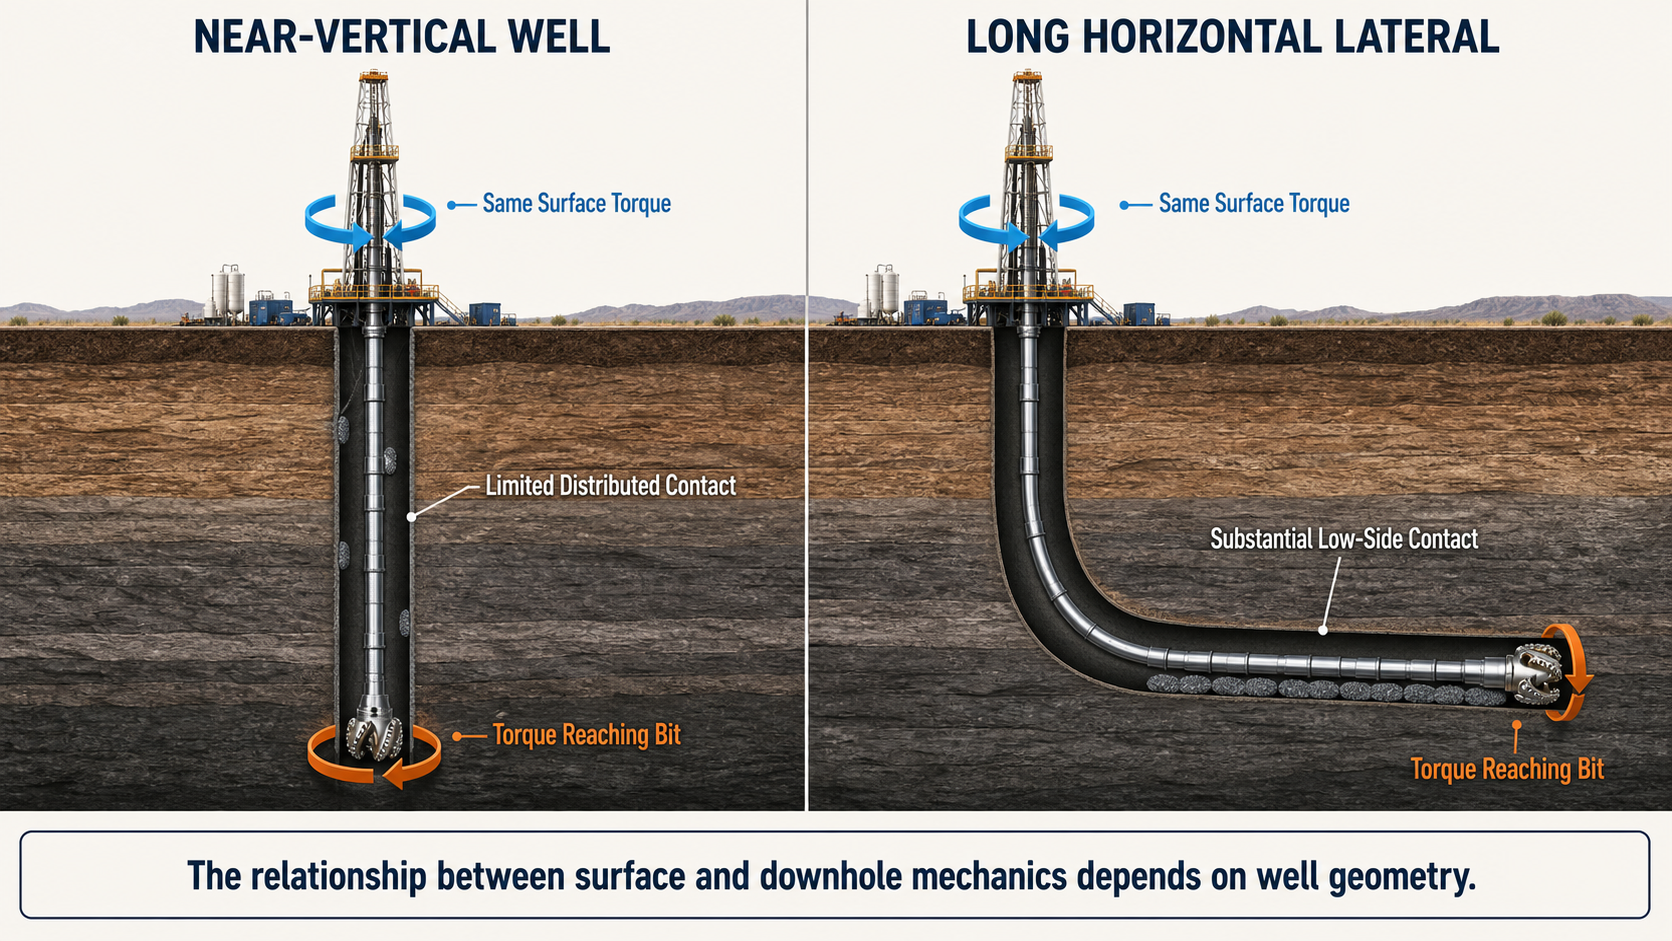
The same surface torque can correspond to different mechanical transfer paths as well geometry and distributed contact change.
Surface Torque Is Not Torque on Bit
Suppose surface torque is:
20,000 ft-lbf
It is tempting to call this:
20,000 ft-lbf torque on bit.
But that description assigns all measured torque to the cutting process.
In a long lateral, surface torque may include substantial torque required simply to rotate the drillstring against the wellbore.
Conceptually:
$$T_{surface} = T_{string} + T_{bit}$$
This is a simplified representation, not a complete torque-and-drag equation.
But it expresses the physical distinction.
The useful engineering quantity for analyzing the cutting response is:
$$T_{bit}$$
not necessarily:
$$T_{surface}$$
SPE/IADC-214608 defines a torque-on-bit ratio as:
$$TOB\ Ratio = \frac{T_{bit,modeled}} {T_{surface}}$$
and uses that relationship to make a bit degradation metric more representative of torque actually reaching the bit in laterals.[2]
The paper's field results showed that incorporating this correction materially improved the behavior of the bit-effectiveness analysis in its US lateral dataset.[2]
The broader lesson extends beyond that particular metric.
Any calculation that interprets surface torque as cutting torque should understand the assumption it is making.
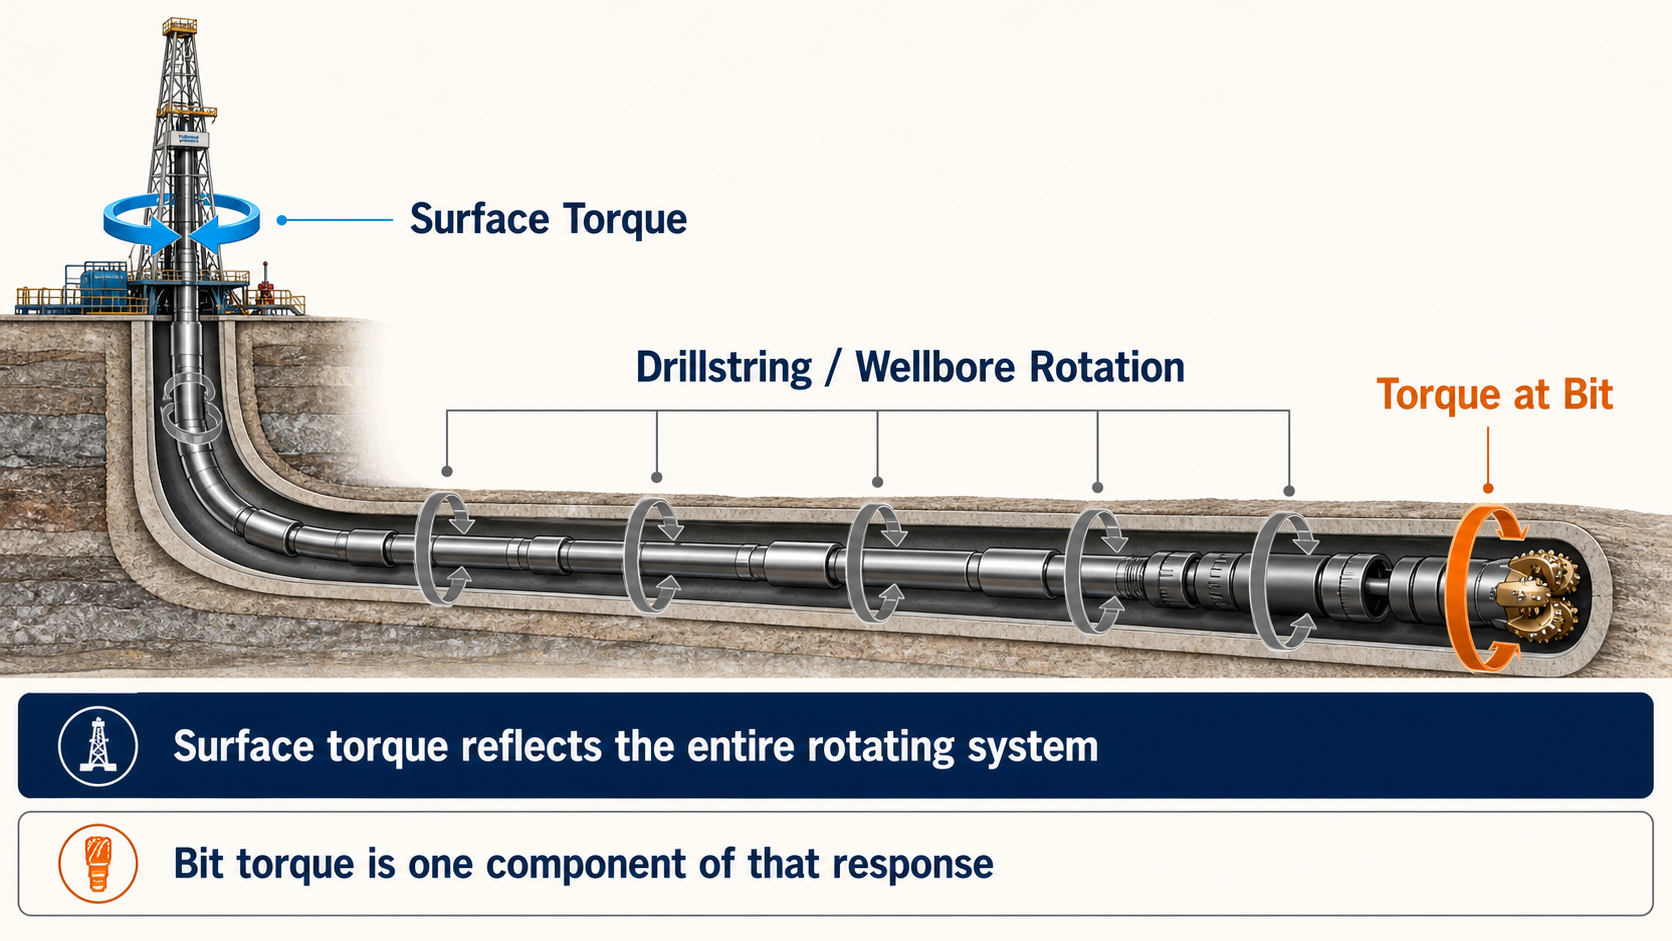
Surface torque reflects the complete rotating system; modeled torque at bit estimates one component of that response.
Surface Torque Is Still Extremely Useful
This does not mean surface torque should be discarded.
Quite the opposite.
Surface torque remains valuable for:
- trend analysis,
- stick-slip surveillance,
- identifying abrupt mechanical changes,
- comparing similar intervals,
- torque-and-drag calibration,
- detecting sensor abnormalities.
For many problems, the movement in the signal matters more than its absolute equivalence to bit torque.
For example:
If surface torque suddenly becomes highly oscillatory while:
- WOB remains stable,
- RPM remains stable,
- formation appears comparable,
that remains meaningful evidence of changing torsional behavior.
The question is simply:
Am I analyzing the surface response of the entire drilling system?
or:
Am I claiming to know torque applied directly at the bit?
Those are different statements.
Weight on Bit Has a Similar Interpretation Problem
WOB appears deceptively simple.
The rig reports:
WOB = 35 klbf
But WOB is generally derived from the change in surface hook load relative to an off-bottom reference.
That makes it fundamentally a surface mechanical quantity.
The actual axial load reaching the bit depends on the mechanical state of the drillstring.
This distinction becomes especially important during:
- sliding,
- high-angle drilling,
- severe drag conditions.
SPE-205844 provides a useful example of being explicit about this assumption.
For its rotary PDC-wear analysis, the authors state that they broadly assumed the WOB recorded at surface was also experienced at the bit.[1]
But sliding intervals were excluded because high surface WOB during sliding was not considered a reliable proxy for formation hardness in that application.[1]
That is good analytical practice.
The authors did not pretend the surface measurement universally represented the bit.
They defined the operating population where the approximation was acceptable for their purpose.
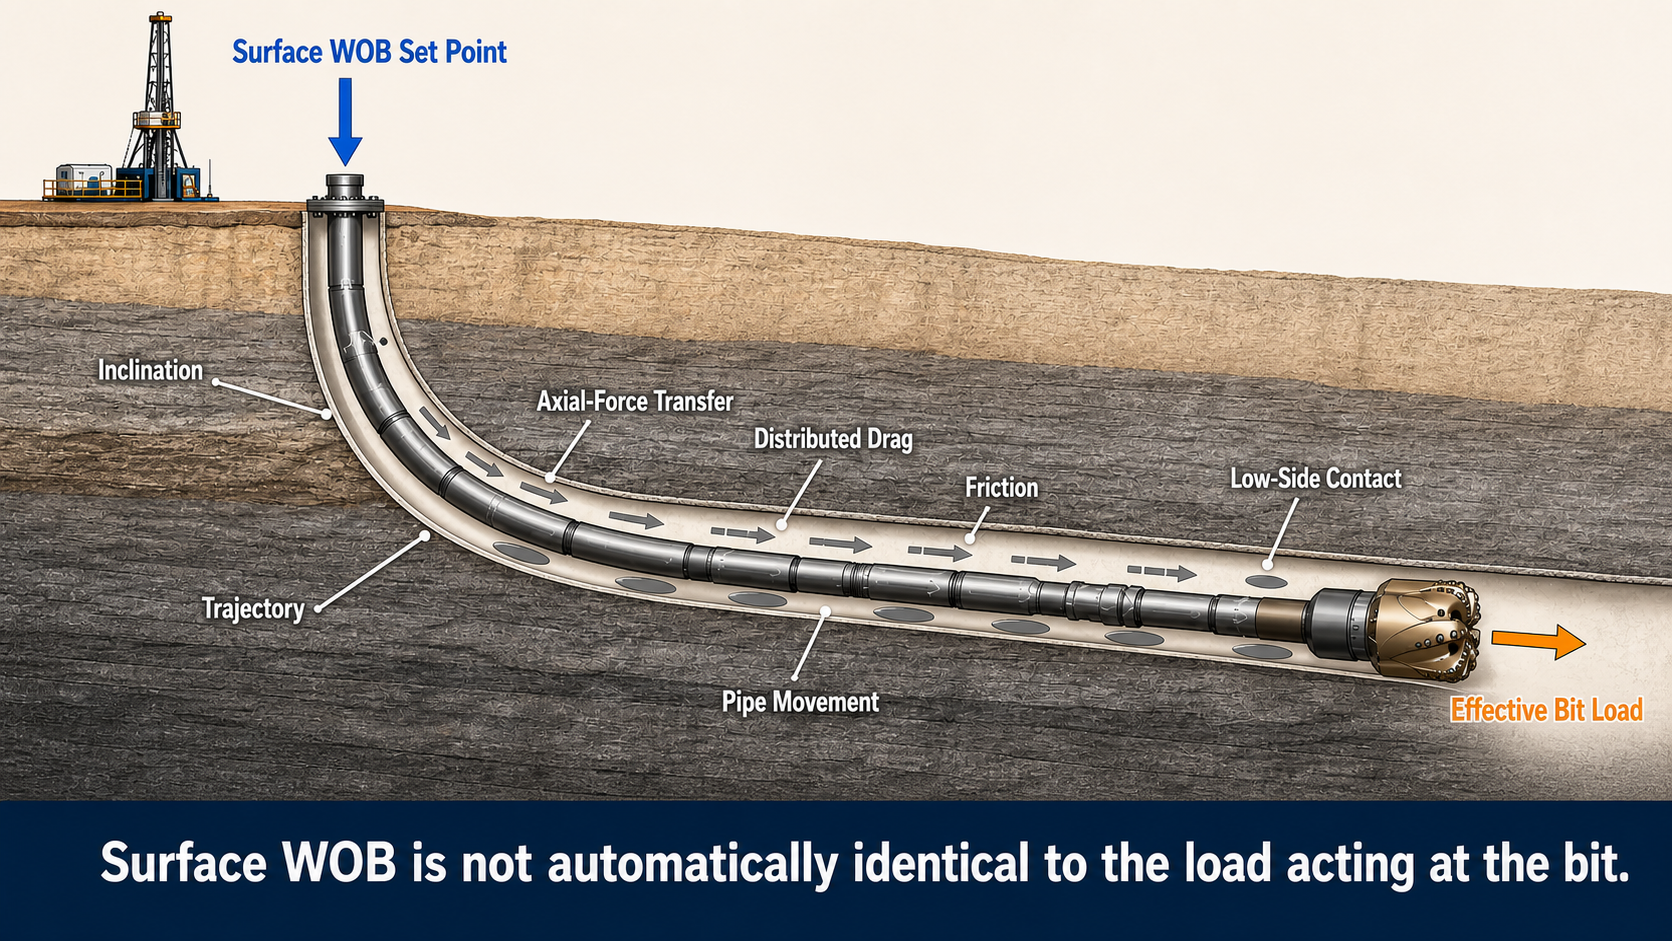
Axial load transfer through a lateral depends on trajectory, pipe movement, friction, and low-side contact; effective bit load is not directly measured by the surface WOB channel.
Sliding Makes the WOB Problem More Visible
Slide drilling is an especially useful example.
During sliding:
- surface rotation is absent,
- the drillstring remains in greater sliding contact with the wellbore,
- directional forces are intentionally being generated,
- axial friction can influence weight transfer.
SPE-196020 provides an explicit field-modeling example.
For a lateral BHA case study, the authors used:
35,000 lb WOB
as the rotary-mode model input.
For sliding, they used:
15,000 lb
because their modeling assumption was that the surface WOB was not fully transferred to the bit due to drag.[5]
Those specific values belong to that case study and should not be generalized into a universal correction factor.
The useful lesson is broader:
The same surface WOB value can have a different mechanical interpretation depending on operating mode and well geometry.
That is one reason slide and rotary performance should normally be analyzed separately.
Surface RPM Becomes Especially Misleading with a Mud Motor
RPM creates perhaps the clearest example.
Suppose the rig is slide drilling.
Surface RPM is:
$$0$$
Is the bit stationary?
No.
A positive-displacement mud motor can rotate the bit even though the drillstring is not rotating from surface.
That means:
$$RPM_{bit} \neq RPM_{surface}$$
For a simplified motor estimate:
$$RPM_{bit} \approx RPM_{surface} + RPM_{motor}$$
SPE-205844 calculated bit RPM this way for its wear analysis, estimating motor RPM from flow rate and the motor's revolutions-per-gallon specification.[1]
For example, consider a hypothetical motor with:
$$0.16\ rev/gal$$
at:
$$650\ gpm$$
Estimated motor speed is:
$$650 \times 0.16 = 104\ rpm$$
During sliding:
$$RPM_{surface}=0$$
but the simplified estimate gives:
$$RPM_{bit}\approx104$$
During rotary drilling at:
$$120\ surface\ rpm$$
the simplified bit-speed estimate becomes:
$$120+104=224\ rpm$$
These are hypothetical values, but the principle is important.
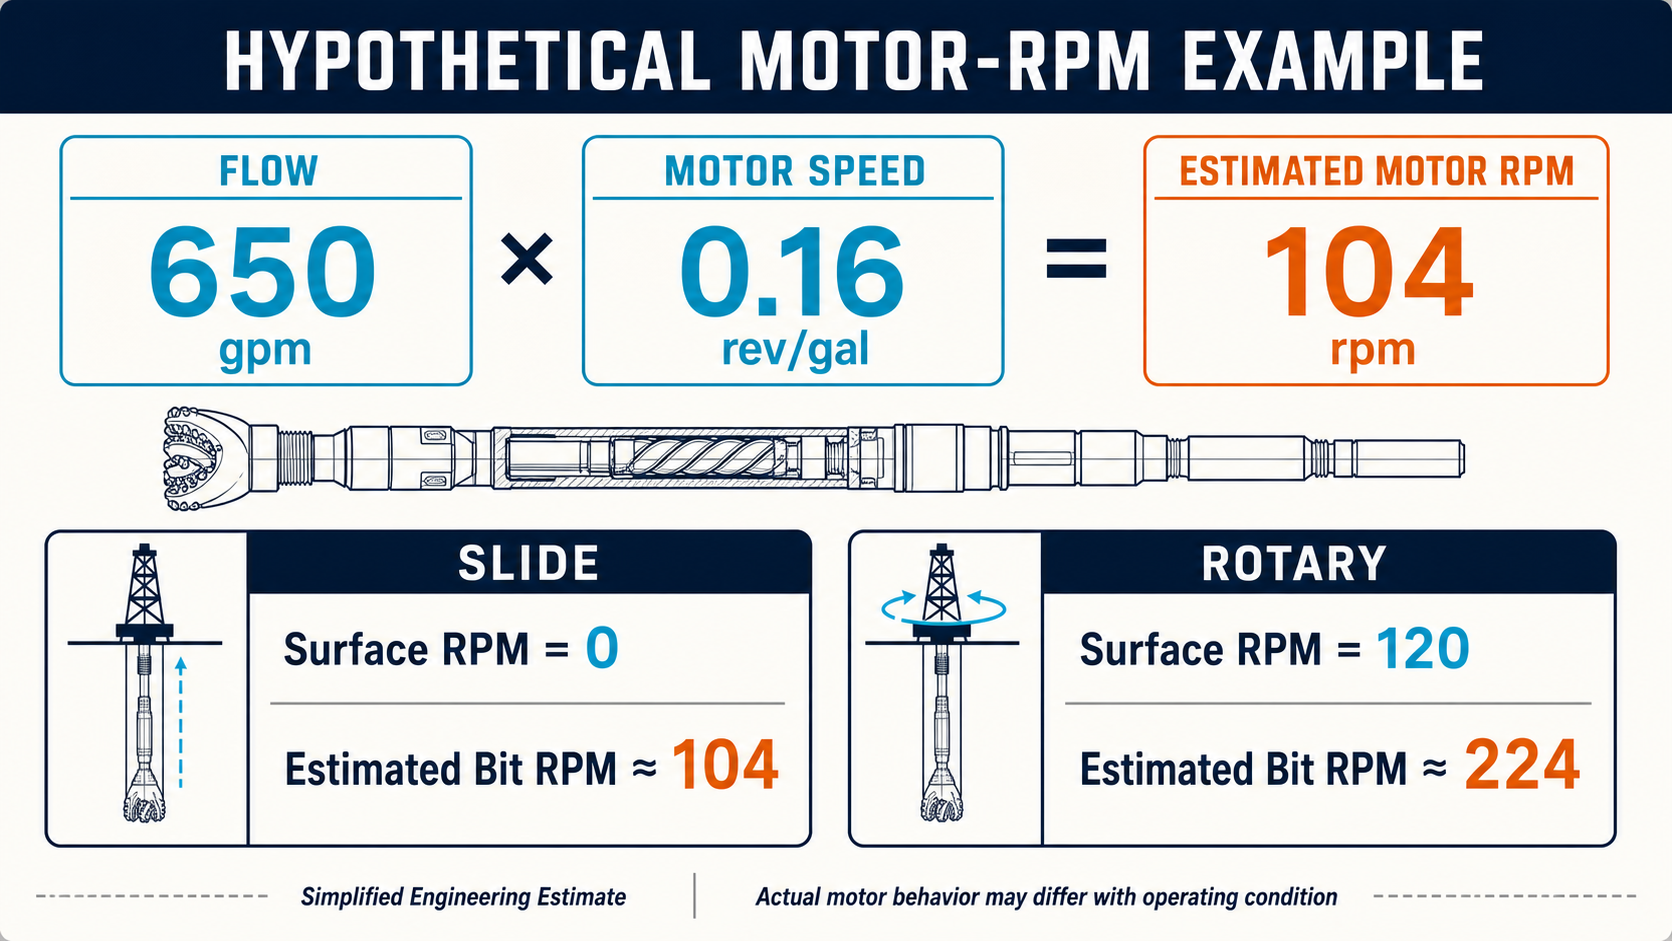
Hypothetical motor-speed example: calculated bit RPM is an engineering estimate based on flow and motor specification, not a direct downhole measurement.
A dashboard showing only:
Surface RPM = 120
may substantially understate the rotational speed relevant to cutter travel when a motor is contributing rotation.
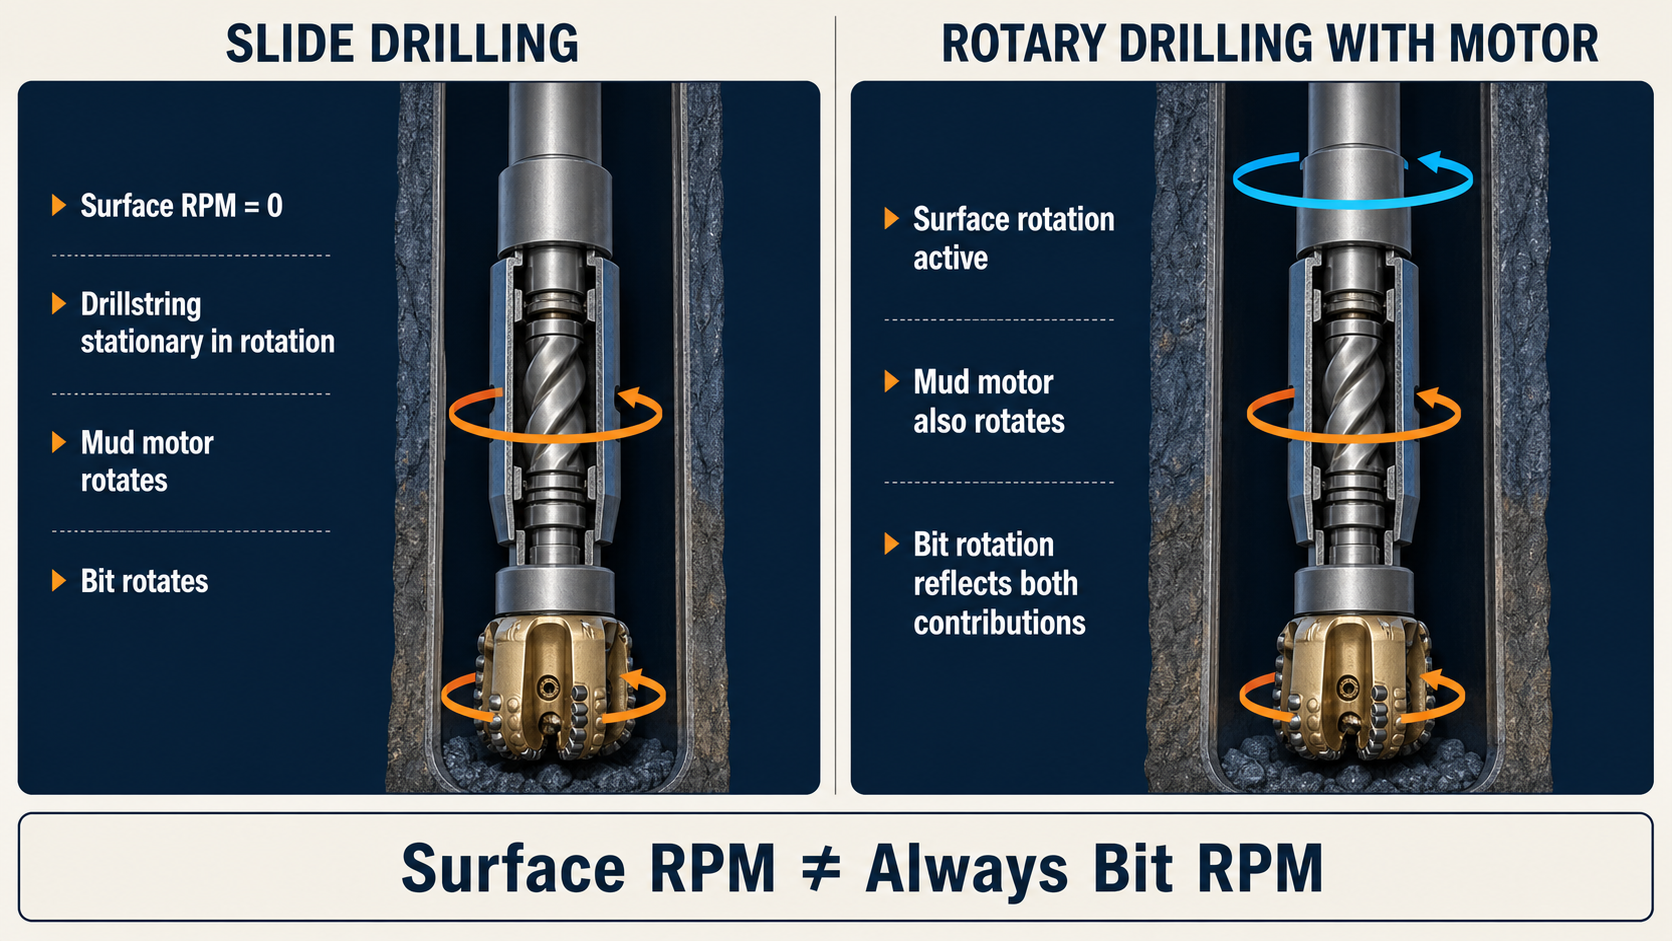
With a mud motor, zero surface RPM during sliding does not imply zero bit RPM; during rotary drilling, both surface rotation and motor speed contribute.
Motor RPM Is Also an Estimate
The calculation:
$$RPM_{motor} = Q \times RPG$$
is useful.
But it remains an estimate based on the motor's performance characteristics.
Actual motor behavior can depend on:
- load,
- differential pressure,
- wear,
- fluid properties,
- motor condition.
This distinction is important because transforming a surface measurement through an engineering relationship does not magically turn it into a direct measurement.
There are several levels of information:
Direct surface measurement
Surface RPM.
Derived estimate
Motor RPM from flow and motor specification.
Estimated bit condition
Surface RPM plus estimated motor RPM.
Direct downhole measurement
Actual downhole rotational measurement, when instrumentation is available.
Each level carries different uncertainty.
A mature analytics system should preserve that distinction.
MSE Makes the Measurement-Basis Problem Obvious
Mechanical Specific Energy combines mechanical inputs into an estimate of energy applied per unit volume of rock removed.
In its common form, rotational energy depends on:
- torque,
- RPM.
Suppose a mud motor is drilling while surface RPM is zero.
If the analysis uses only surface RPM and surface torque, the rotational energy generated by the motor is not represented correctly.
SPE-186166 explicitly notes that when a downhole motor is present, effective downhole RPM and motor-generated torque can replace surface values in the MSE formulation.[3]
That does not mean every MSE calculation must use modeled downhole quantities.
It means the analyst should understand what the selected formulation represents.
Surface MSE
describes drilling mechanics using surface quantities.
Motor-adjusted MSE
attempts to represent more of the mechanical energy acting at the bit.
These can both be useful.
They are not numerically interchangeable.
The Same KPI Can Change When the Measurement Basis Changes
Imagine two analysts calculating drilling efficiency.
Analyst A
uses:
- surface WOB,
- surface RPM,
- surface torque.
Analyst B
uses:
- estimated bit WOB,
- estimated bit RPM,
- estimated torque at bit.
Both calculations may be internally valid.
But they are no longer using the same physical inputs.
Comparing the absolute results as though they were generated by identical methodologies can be misleading.
This creates an important benchmarking rule:
Measurement basis should travel with the KPI.
A useful metadata definition might include:
- WOB source: surface / modeled downhole / measured downhole
- RPM source: surface / motor-adjusted / downhole
- torque source: surface / modeled bit / downhole
- model version
- motor specification used
- friction calibration basis
Without that information, a historical metric can lose its physical meaning.
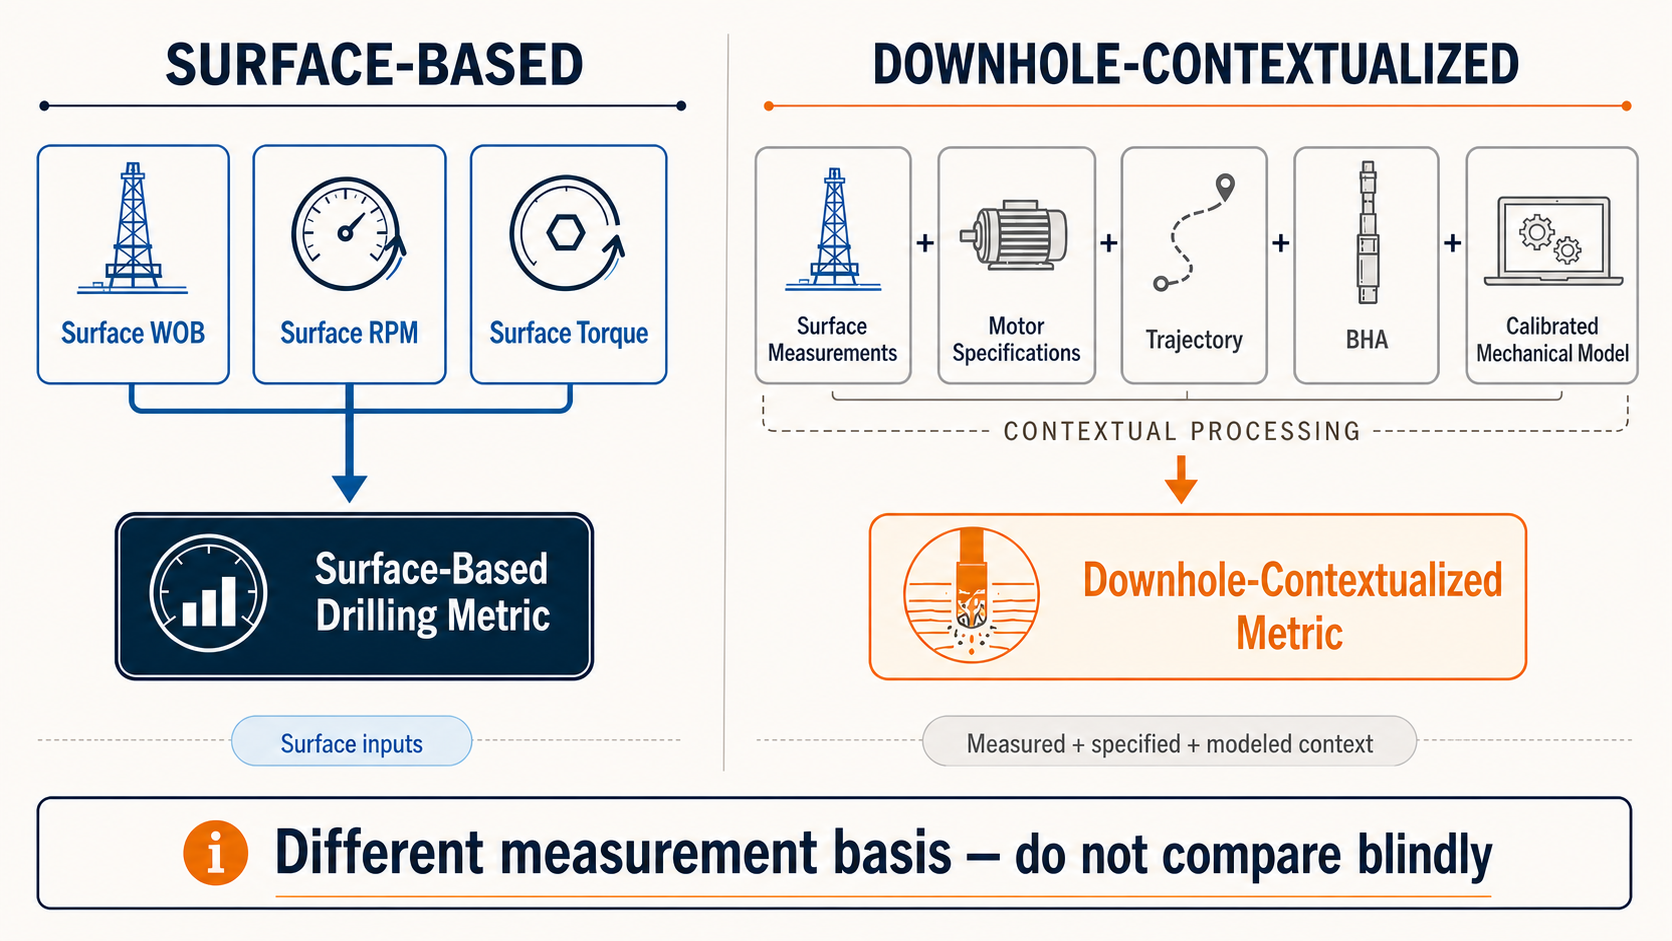
A surface-based metric and a downhole-contextualized metric use different input bases and should not be compared without preserving provenance.
WOB-RPM Maps Also Depend on Which WOB and RPM
Operating maps are commonly built in:
$$WOB-RPM$$
space.
But which WOB?
Which RPM?
A map based on:
surface WOB + surface RPM
does not represent exactly the same operating space as:
estimated bit WOB + bit RPM.
This matters particularly when:
- one well uses a motor,
- another does not,
- one interval is rotary,
- another contains slide drilling,
- well geometries differ materially.
SPE-186166 itself describes drilling-efficiency maps using surface WOB/RPM values and cautions that operating regions can vary substantially between wells.[3]
Part of that variability reflects the fact that the rest of the drilling system also changes:
- bit condition,
- tortuosity,
- hole cleaning,
- motor condition,
- formation.
The WOB-RPM pair is useful.
It is not the complete physical state.
Directional Response Has the Same Context Problem
Consider a BHA that builds:
8°/100 ft
at a particular WOB.
Will it build exactly the same amount elsewhere at the same surface WOB?
Not necessarily.
SPE-196020 describes directional tendency as depending on the combined behavior of:
- bit characteristics,
- formation hardness,
- BHA geometry,
- stabilizers,
- hole overgauge,
- WOB.
The paper notes that the same bit and BHA can generate different build/drop tendencies in different formations.[5]
It also shows that BHA deflection and contact points change as compression/WOB changes.[5]
This reinforces a broader message:
A surface set point is one input into a mechanical system—not a complete prediction of the downhole response.
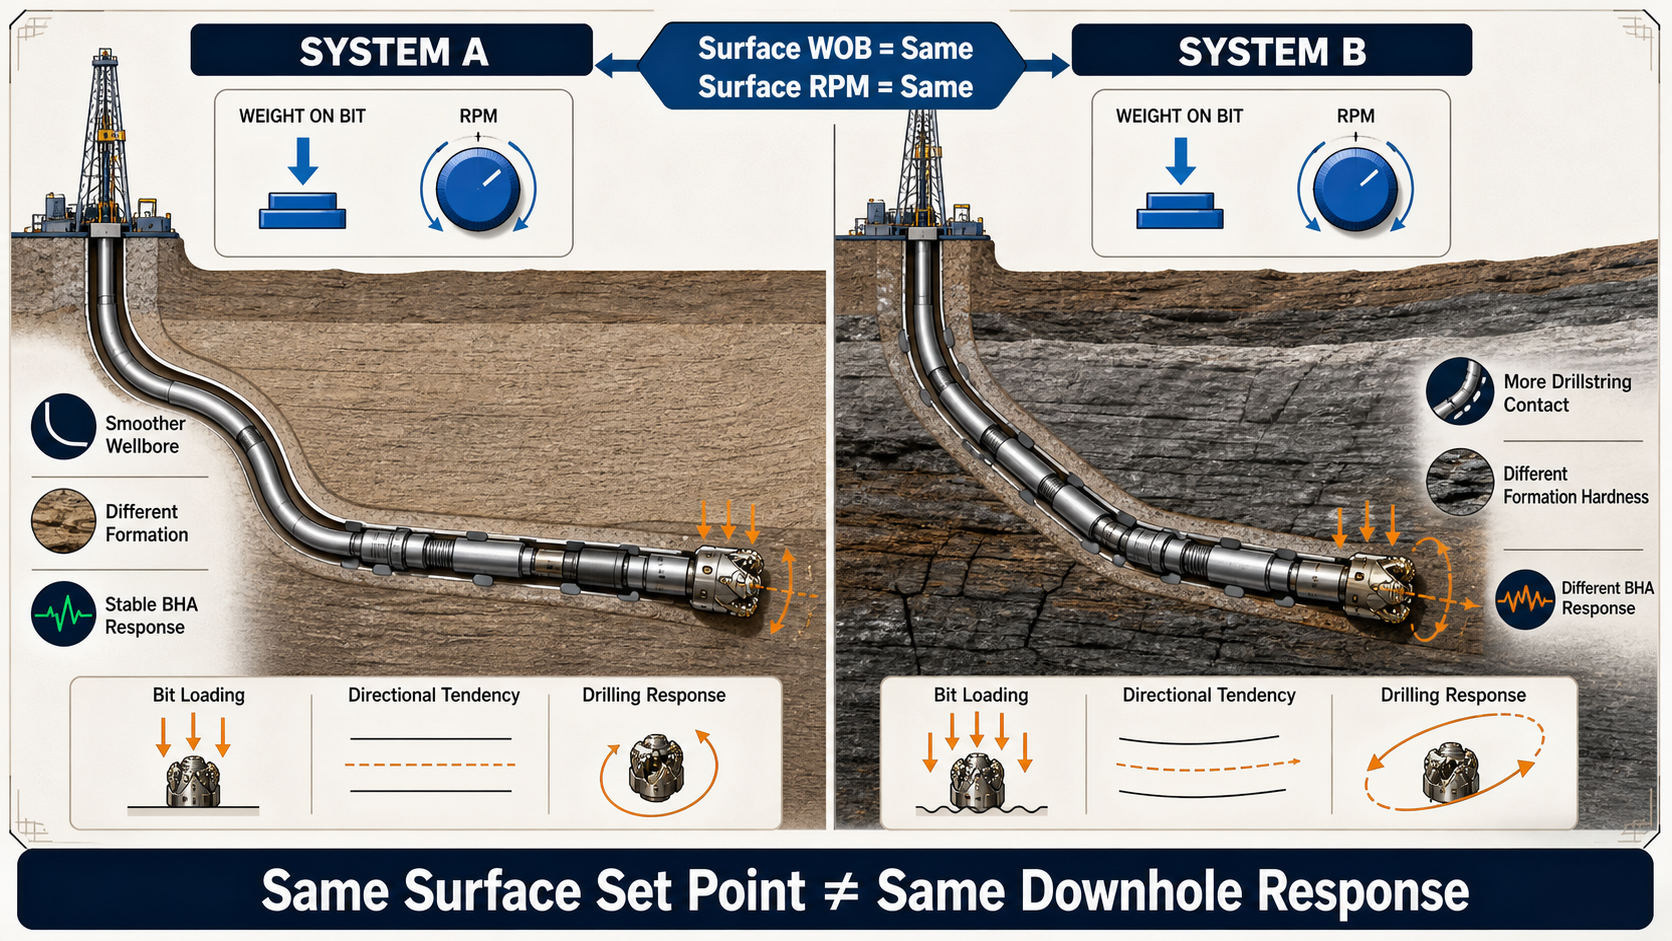
Identical surface set points can produce different downhole responses when formation, wellbore contact, and BHA behavior differ.
Why Surface Measurements Remain the Backbone of Real-Time Analytics
At this point it might sound as though surface data is inadequate.
That would be the wrong conclusion.
Surface data is the backbone of real-time drilling surveillance because it offers something downhole instrumentation often cannot provide universally across an entire fleet:
- continuous availability,
- standardized collection,
- low incremental cost,
- immediate access,
- long historical datasets.
Many useful analyses do not require exact knowledge of bit conditions.
For example:
Change detection
A torque increase can matter even if absolute torque-on-bit is unknown.
Offset comparison
Surface WOB can be highly useful when the offsets use the same measurement basis and comparable well conditions.
Dysfunction surveillance
Surface torque oscillations contain meaningful information about torsional dynamics.
Operational benchmarking
The driller's actual WOB and RPM settings are operationally relevant because those are the controls being manipulated.
The correct conclusion is:
Use surface measurements aggressively—but interpret them as surface measurements.
Model-Based Estimates Can Add Context
Physics-based models provide one way of translating surface measurements toward downhole quantities.
For example, a torque-and-drag model can use:
- surveys,
- pipe geometry,
- BHA,
- mud properties,
- casing,
- friction,
to estimate the mechanical response along the drillstring.
SPE-191426 demonstrates exactly this type of real-time model, calculating axial force and torque through the drillstring and calibrating friction using measured field data.[4]
This creates a useful analytical architecture:
$$Surface\ Measurements + Well\ Context + Physics \rightarrow Estimated\ Downhole\ Conditions$$
But that last word matters:
estimated.
A Modeled Downhole Value Is Not Ground Truth
Suppose a model estimates:
Torque at Bit = 12,500 ft-lbf
to one decimal place.
That numerical precision should not be confused with physical certainty.
The estimate depends on:
- survey quality,
- string description,
- pipe properties,
- block-weight calibration,
- friction factors,
- hole geometry,
- mud properties,
- surface sensor quality.
SPE-191426 shows how substantial effort was required simply to calibrate:
- effective drillpipe weight,
- friction factors,
- block-weight offset
before the real-time torque-and-drag model was considered reliable enough for operational use.[4]
The correct language is therefore:
Modeled TOB = 12.5 klbf-ft
rather than:
Actual TOB = exactly 12.5 klbf-ft
unless direct measurement supports that statement.
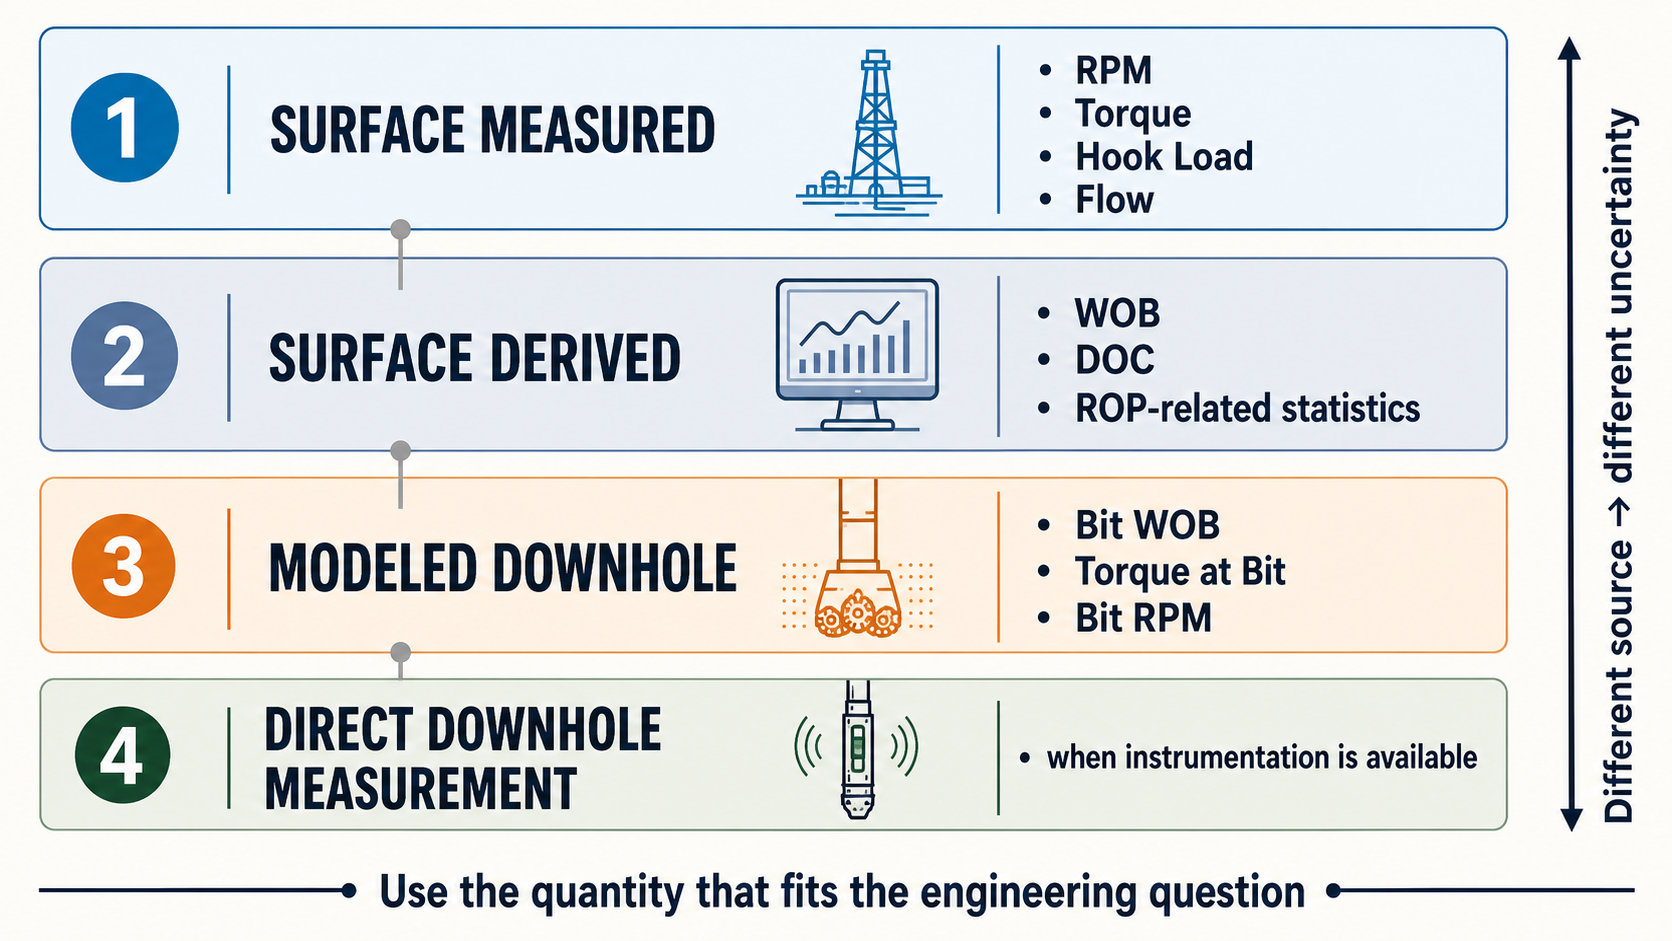
Measurement provenance should remain explicit: surface-measured, surface-derived, modeled downhole, and directly measured downhole quantities carry different uncertainties.
Model Calibration Is What Makes Translation Useful
Suppose a torque-and-drag model predicts much less hook load than the rig measures.
Possible explanations include:
- friction is higher,
- effective pipe weight is wrong,
- block-weight offset is wrong,
- trajectory/context is wrong,
- hook-load sensor is wrong.
If the model immediately uses the discrepancy to estimate bit WOB, the resulting downhole estimate may simply inherit the model error.
This is why the real-time T&D workflow in SPE-191426 performs calibration before using the model operationally.[4]
That leads to another general rule:
Do not infer an unmeasured downhole quantity from a model that has not first demonstrated reasonable agreement with observable surface behavior.
A Practical Example
Consider a hypothetical lateral interval.
Surface data shows:
- WOB: 35 klbf
- Surface RPM: 120
- Surface Torque: 20 klbf-ft
- Flow: 650 gpm
- ROP: 180 ft/hr
The BHA contains a motor with a simplified speed specification of:
$$0.16\ rev/gal$$
Surface interpretation
The dashboard reports:
- 35 klbf WOB
- 120 RPM
- 20 klbf-ft torque
Those values correctly describe the surface operating condition.
Motor-adjusted RPM interpretation
Estimated motor speed:
$$650 \times 0.16 = 104\ rpm$$
Estimated bit RPM:
$$120 + 104 = 224\ rpm$$
Now the cutting-speed interpretation is materially different.
Torque interpretation
Suppose a calibrated mechanical model—purely for this hypothetical example—estimates a torque-on-bit ratio of:
$$0.60$$
Then:
$$T_{bit} \approx 20,000 \times 0.60 = 12,000\ ft-lbf$$
Again, this is an estimate.
But the physical interpretation becomes:
- surface drivetrain is supplying 20 klbf-ft,
- modeled bit torque is approximately 12 klbf-ft,
- the remainder is associated with rotation of the drillstring/wellbore system.
Now imagine comparing that interval with a vertical offset where surface and bit torque are much closer.
A raw comparison of:
20 klbf-ft vs 20 klbf-ft
could imply identical bit loading.
The modeled interpretation suggests otherwise.
That is the value of downhole context.
Slide Drilling Makes the Contrast Even Stronger
Now stop surface rotation.
Surface values become:
- Surface RPM = 0
- Motor RPM estimate = 104
- Bit RPM estimate ≈ 104
If an analysis interprets:
$$Surface\ RPM=0$$
as:
$$Bit\ RPM=0$$
it has fundamentally misunderstood the operation.
This is why slide drilling deserves separate analytics.
A slide is not merely rotary drilling with one channel set to zero.
It represents a different mechanical state involving:
- motor-generated bit rotation,
- toolface,
- directional response,
- altered axial-force transfer,
- different surface torque interpretation.
SPE-186166 specifically notes that slide-drilling efficiency is harder to quantify without real-time directional data and accurate BHA/motor context.[3]
That is an important warning against applying rotary metrics unchanged to sliding.
Surface-to-Downhole Differences Can Change With Depth
The relationship is not necessarily constant through a run.
As the lateral becomes longer:
- contact length changes,
- frictional interaction changes,
- hole condition changes,
- tortuosity changes,
- bit condition changes.
Therefore, a surface-to-bit relationship calibrated earlier in the well may not remain identical later.
That argues against using one fixed correction such as:
Bit torque is always 70% of surface torque.
A physics-based approach instead updates the mechanical condition using:
- current depth,
- current geometry,
- calibrated friction,
- current BHA/string configuration.
The correction should follow the well.
Comparing Surface and Modeled Downhole Trends Can Be Informative
Instead of treating a modeled downhole value as a replacement for the surface value, it can be useful to display both.
For example:
Surface Torque
shows what the top drive is experiencing.
Modeled Torque at Bit
estimates what portion of that mechanical input is reaching the cutting structure.
The difference:
$$T_{surface} - T_{bit,modeled}$$
can provide additional context about the mechanical system.
Likewise:
surface WOB and modeled bit WOB can tell different stories.
The difference itself may become an engineering signal.
The important requirement is to make the provenance obvious.
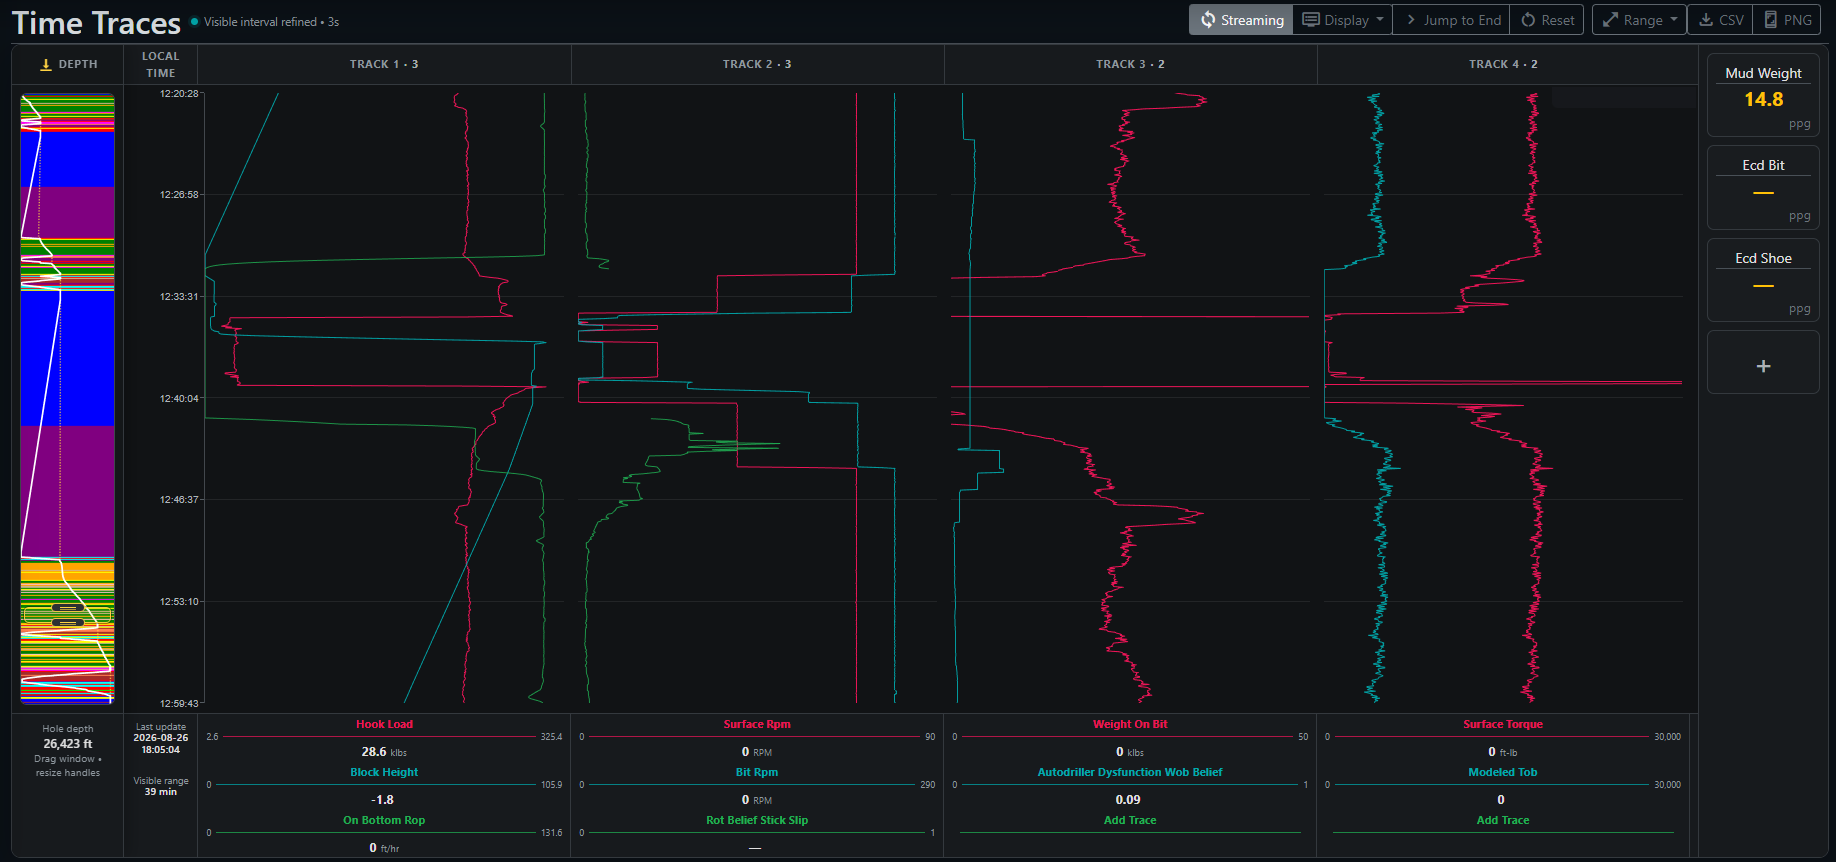
DrillingMetrics Time Traces compare surface and modeled quantities through a connection and return-to-bottom sequence. Surface RPM is shown with calculated bit RPM, while surface torque is shown with modeled torque at bit. The rotational stick-slip belief increases transiently as drilling resumes. Modeled quantities and belief scores are estimates—not direct downhole measurements.
A Useful Data Model Should Preserve Provenance
Consider a database field named:
wob
What does it contain?
Possibilities include:
- rig-reported surface WOB,
- recalculated surface WOB,
- modeled downhole WOB,
- downhole measured WOB.
Calling all four:
WOB
creates ambiguity.
The same is true for:
- RPM,
- torque,
- MSE.
A mature drilling data architecture benefits from explicit naming or metadata such as:
Surface WOB
Modeled Bit WOB
Surface RPM
Estimated Bit RPM
Surface Torque
Modeled TOB
Then every dashboard, API, and post-well analysis knows what physical quantity is actually being used.
That becomes especially important when data is reused years later.
Benchmarking Should Preserve Measurement Basis
Suppose one historical well's WOB-RPM roadmap was generated using:
- surface WOB,
- surface RPM.
The current well uses:
- modeled bit WOB,
- motor-adjusted bit RPM.
Overlaying those numbers in the same operating map without conversion creates a subtle inconsistency.
The points may look directly comparable.
They are not.
The benchmark should therefore preserve:
- measurement location,
- calculation method,
- motor correction,
- model version where relevant.
This is another reason analytics provenance matters as drilling systems become more sophisticated.
Do Not Correct Surface Measurements Merely Because You Can
There is also a danger in the opposite direction.
Once a model can estimate a downhole quantity, there may be a temptation to replace every surface measurement with its modeled counterpart.
That is not always necessary.
If the question is:
What WOB was the driller running?
use surface WOB.
If the question is:
How much load likely reached the bit?
a modeled downhole WOB may be more relevant.
If the question is:
Is top-drive torque approaching an equipment limit?
use surface torque.
If the question is:
What torque should be used in a bit-performance metric?
modeled torque at the bit may be more appropriate.
The correct variable depends on the physical question.
A Practical Interpretation Hierarchy
When reviewing a drilling parameter, ask four questions.
1. Where was it measured?
Surface or downhole?
2. Is it actually measured or calculated?
A rig-reported WOB is itself generally derived from hook-load behavior.
Modeled TOB adds another calculation layer.
3. What physics separates the measurement from the quantity of interest?
Examples:
- drillstring friction,
- motor contribution,
- wellbore contact,
- BHA deflection.
4. Does the difference matter for this question?
For a high-level trend:
maybe not.
For a detailed bit-wear model:
possibly very much.
That framework avoids two extremes:
Surface measurements are always equal to downhole conditions.
and:
Surface measurements are useless unless downhole corrected.
Both are wrong.
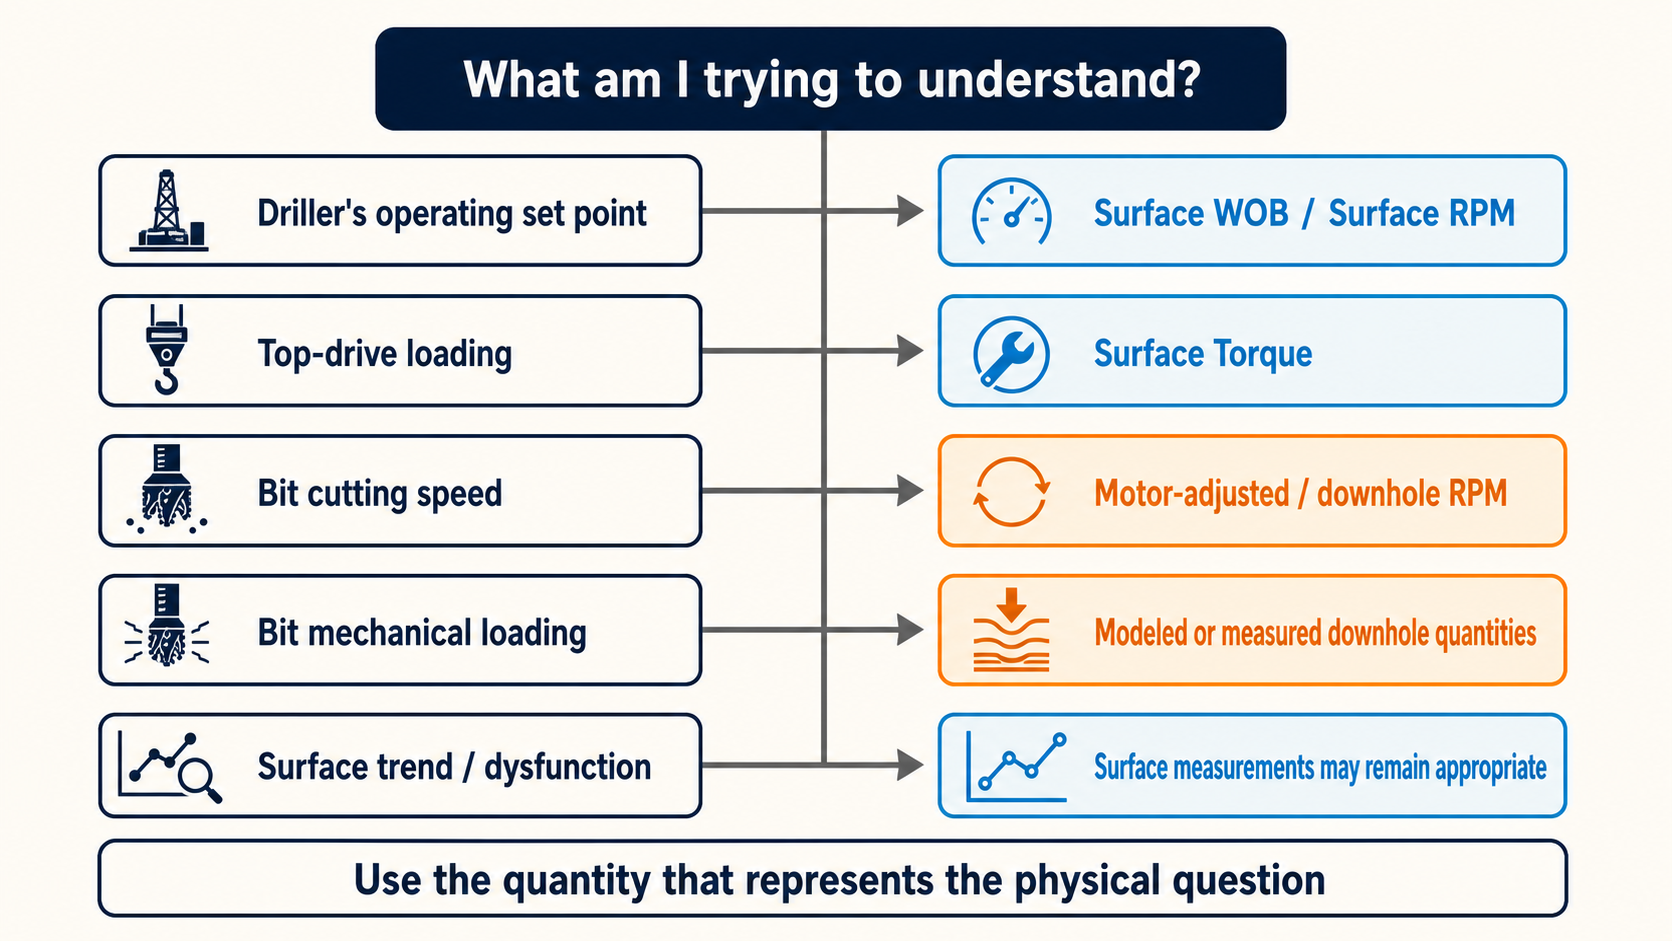
Select the quantity that represents the engineering question rather than substituting modeled values for surface measurements by default.
The More Specific the Engineering Claim, the More Context It Requires
A surface measurement supports statements such as:
Surface torque increased.
That is directly observed.
It may support:
Torsional behavior changed.
when corroborated by the signal pattern.
A physics-based model may support:
Estimated torque reaching the bit decreased.
That is a model-based interpretation.
Making the stronger claim:
The bit experienced exactly 11,800 ft-lbf
requires stronger evidence.
This hierarchy is important in real-time drilling intelligence.
The software should distinguish:
- measurement,
- calculation,
- model estimate,
- engineering inference.
Those categories should not be collapsed simply because they can all be plotted as traces.
The Surface Rig Is Observing a Downhole System Through a Mechanical Filter
That may be the most useful way to think about the problem.
Surface sensors observe the downhole drilling process through:
- thousands of feet of drillstring,
- contact with the wellbore,
- friction,
- motors,
- BHA mechanics,
- fluid systems.
The signals are not meaningless because of that filter.
They are simply filtered observations of the downhole process.
Much of modern drilling analytics is about reconstructing useful engineering meaning from those observations.
Sometimes the correct answer is a raw surface trend.
Sometimes it is a deterministic transformation.
Sometimes it requires a calibrated physical model.
Sometimes the uncertainty is too large to justify a more specific downhole estimate.
Understanding which situation applies is what turns surface data into drilling intelligence.
Conclusion
WOB, RPM, and torque are among the most familiar values on a drilling screen.
Their familiarity can make their physical meaning seem simpler than it is.
Surface WOB describes the surface mechanical response used to infer axial loading.
Surface RPM describes drillstring rotation from the top drive.
Surface torque describes the torque required to rotate the system from surface.
At the bit, the relevant conditions may differ because of:
- friction,
- well geometry,
- BHA interaction,
- mud-motor contribution,
- operating mode.
That does not reduce the value of surface data.
It defines how the data should be used.
The most defensible real-time analysis therefore asks not only:
What value is the rig reporting?
but also:
What physical quantity does this measurement represent, and how closely does that quantity correspond to the condition I actually want to understand?
That question becomes increasingly important as drilling analytics move from displaying measurements to making engineering decisions from them.
References
-
Witt-Doerring, Y., Pastusek, P. P., Ashok, P., and van Oort, E. Quantifying PDC Bit Wear in Real-Time and Establishing an Effective Bit Pull Criterion Using Surface Sensors. SPE-205844-MS, SPE Annual Technical Conference and Exhibition, 2021.
-
Yi, M., Ashok, P., Ramos, D., Pearce, J., Hickin, G., Peroyea, T., White, S., Thetford, T., and Behounek, M. Field Deployment of a Real-Time Bit Pull Advisory System. SPE/IADC-214608-MS, SPE/IADC Middle East Drilling Technology Conference and Exhibition, Abu Dhabi, 2023.
-
Ambrus, A., Ashok, P., Chintapalli, A., Ramos, D., Behounek, M., Thetford, T. S., and Nelson, B. A Novel Probabilistic Rig Based Drilling Optimization Index to Improve Drilling Performance. SPE-186166-MS, SPE Offshore Europe Conference & Exhibition, Aberdeen, 2017.
-
Shahri, M., Wilson, T., Thetford, T., Nelson, B., Behounek, M., Ambrus, A., D'Angelo, J., and Ashok, P. Implementation of a Fully Automated Real-Time Torque and Drag Model for Improving Drilling Performance: Case Study. SPE-191426-MS, SPE Annual Technical Conference and Exhibition, Dallas, Texas, 2018.
-
Shahri, M., James, M., Vasicek, A., De Napoli, R., White, M., Behounek, M., D'Angelo, J., Ashok, P., and van Oort, E. Case Studies: Optimizing BHA Performance by Leveraging Data and Advanced Modeling. SPE-196020-MS, SPE Annual Technical Conference and Exhibition, Calgary, 2019.