ROP measures how quickly new hole is made. It does not reveal energy transfer, drilling dynamics, bit condition, hole cleaning, or wellbore quality. High ROP should therefore be judged as one outcome inside a sustainable operating envelope, not as a complete diagnosis of drilling efficiency.
Add energy-efficiency context
One way to move beyond ROP is Mechanical Specific Energy, or MSE. MSE combines several drilling parameters to estimate the mechanical energy required to remove a unit volume of rock. It asks:
How much mechanical work are we putting into the drilling process for the amount of rock we are actually removing?
This makes MSE fundamentally different from ROP. ROP measures output. MSE relates that output to mechanical input. If considerably more mechanical energy is required to maintain the same drilling rate, that can be evidence that the drilling process has become less efficient. MSE therefore provides an important additional perspective for real-time drilling surveillance. But it introduces another important lesson: MSE is not a complete diagnosis either. SPE-186166 notes that MSE trends can indicate inefficient drilling without uniquely identifying whether the underlying cause is stick-slip, whirl, bit bounce, bit balling, a formation change, poor hydraulics, or another condition.[1]
The same increase in MSE can therefore have several different interpretations.
Look past the average response
Take two one-minute torque traces with the same 15,000-ft-lbf average:
- Interval A: Torque remains between approximately 14,500 and 15,500 ft-lbf for most of the interval.
- Interval B: Torque repeatedly cycles between 8,000 and 22,000 ft-lbf.
The average may still be approximately 15,000 ft-lbf. But these are not equivalent drilling conditions. Averages discard information about how the signal behaves. This is why real-time dysfunction analysis often evaluates both the magnitude and movement of drilling measurements. The methodology described in SPE-186166 used moving windows to identify whether selected parameters were:
- increasing,
- decreasing,
- relatively constant,
- or erratic.[1]
Linear fitting was used to characterize trends, while variability within a window provided additional information about erratic behavior. That creates a more informative question than:
What was average torque?
The better question becomes:
What was torque doing?
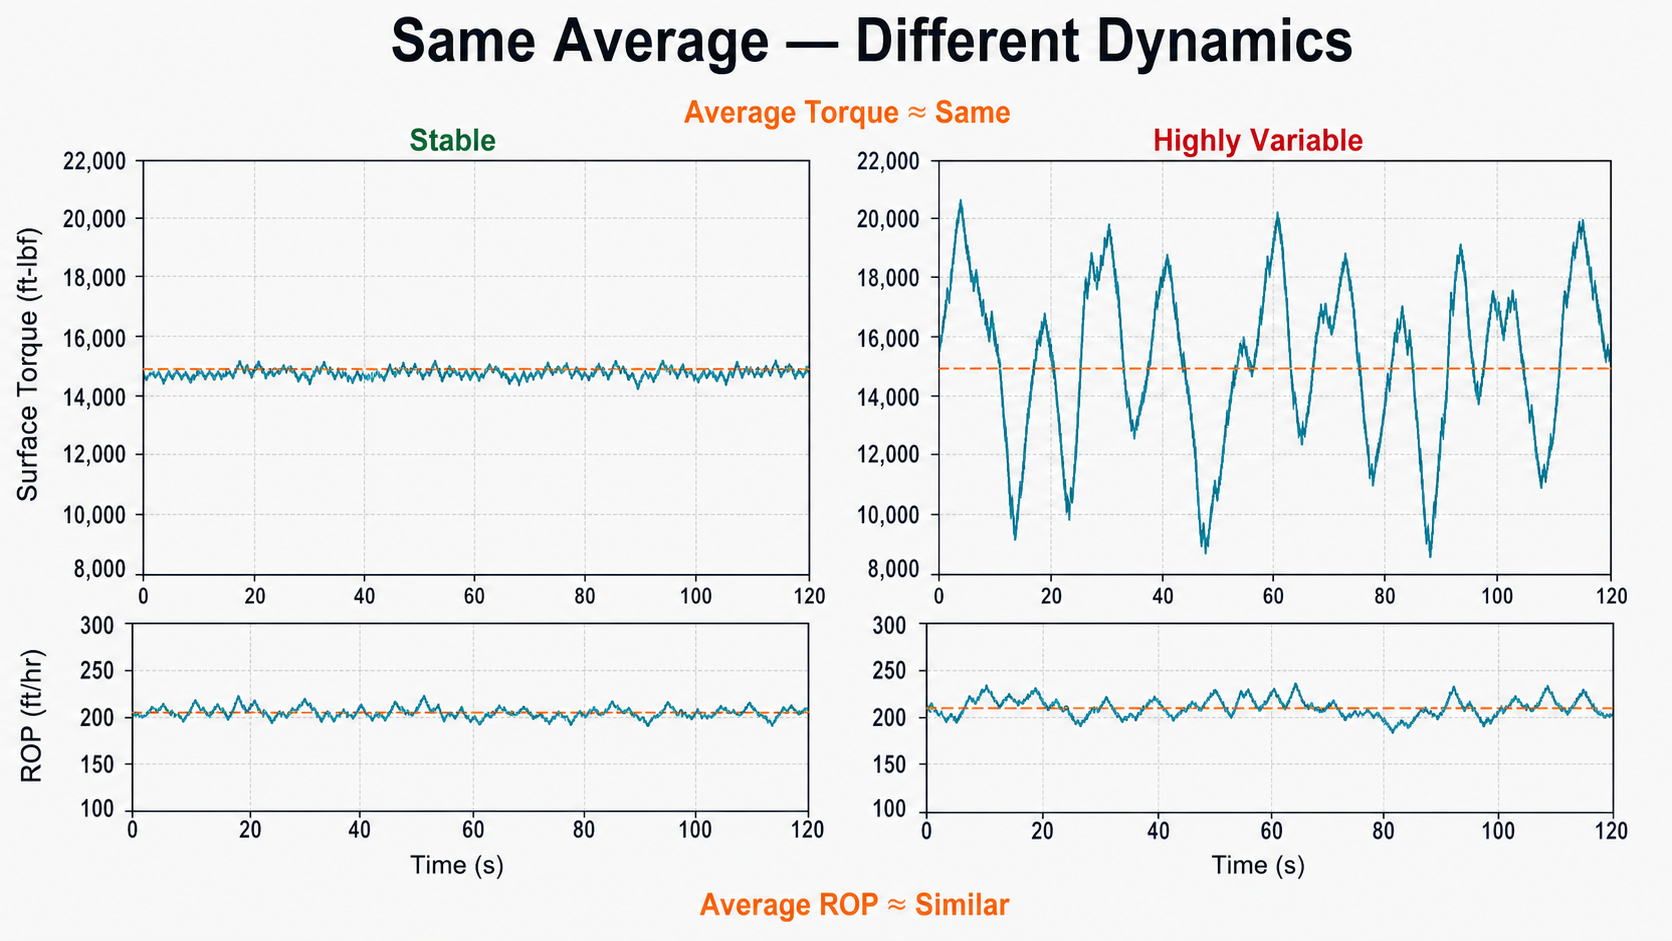
Average values can conceal drilling dysfunction; signal behavior provides information that ROP and averages alone do not.
A useful field example appears in SPE-186166. Six wells on the same pad were evaluated at approximately the same measured depth during rotary drilling.[1] Several wells had relatively high calculated drilling efficiency. Two wells showed lower efficiency because stick-slip was detected. Importantly, ROP remained high. The published figure includes examples around:
- approximately 200 ft/hr with substantially reduced drilling efficiency,
- approximately 213 ft/hr with detectable stick-slip,
- and approximately 223 ft/hr with high drilling efficiency.
The point is not that 200 ft/hr is inefficient or that 223 ft/hr is efficient. Those values belong to that specific dataset. The important observation is that high ROP existed on both sides of the efficiency comparison. If an engineer had ranked those wells using ROP alone, some of the underlying mechanical differences would have been missed.
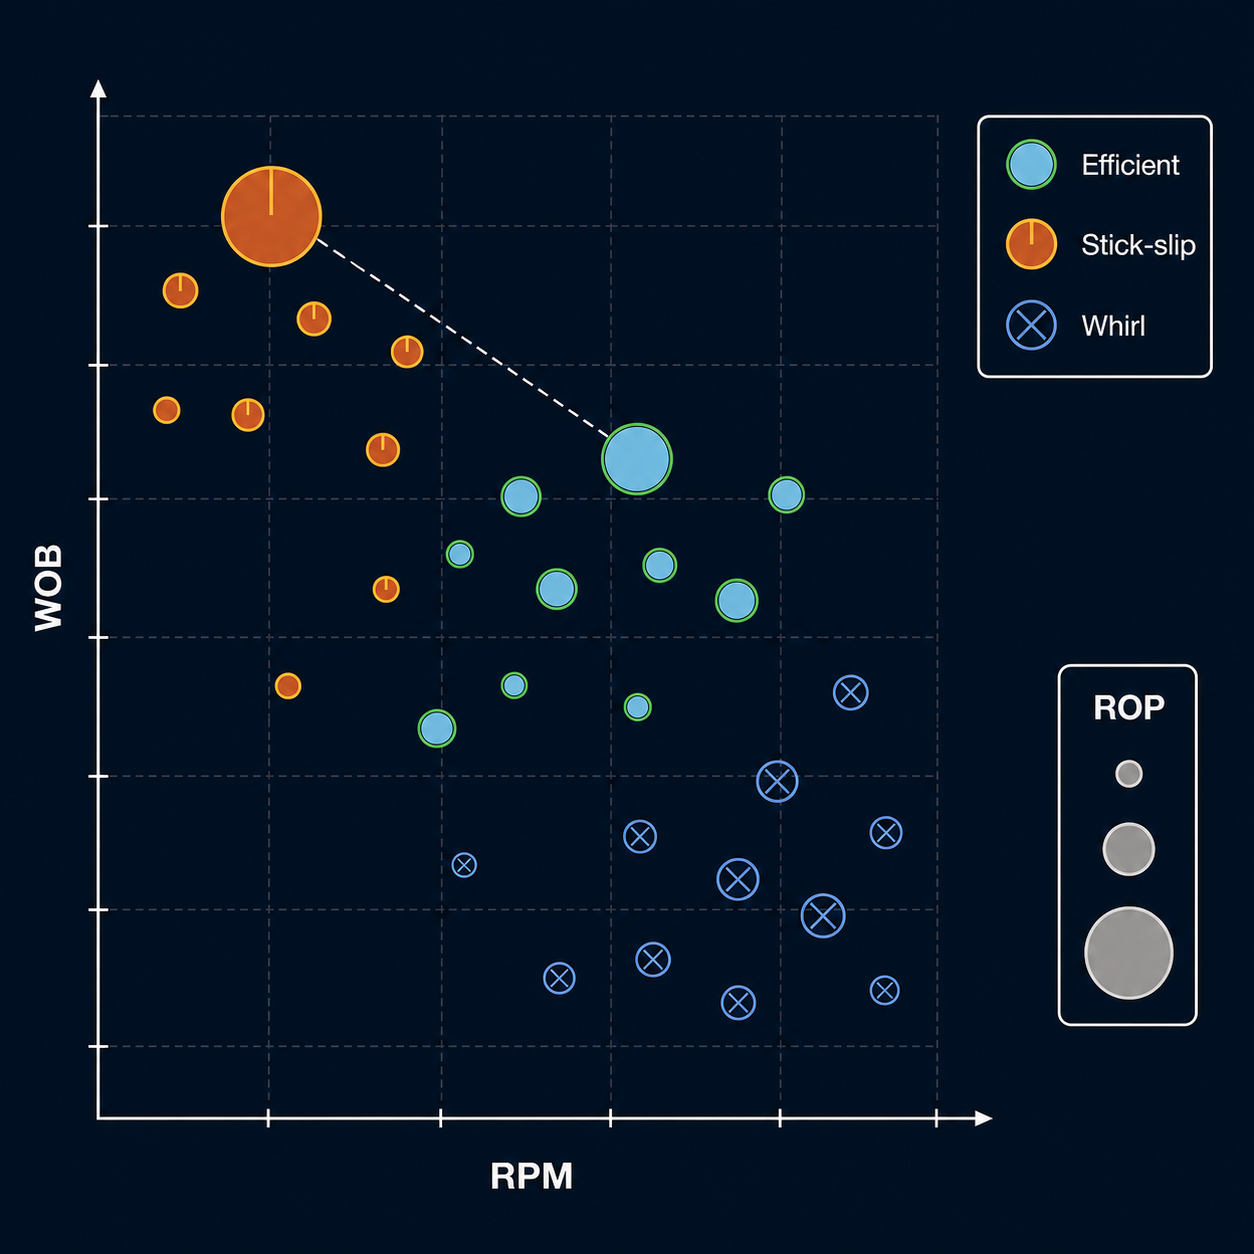
Synthetic WOB-RPM operating space illustrating how similar ROP can occur in both efficient and dysfunctional regions.
Another important observation from the field study was that similar WOB and RPM values did not necessarily produce similar drilling efficiency. At another depth, two wells operating at similar WOB and RPM showed very different calculated efficiency values.[1] The authors identified several potential contributors:
- bit condition,
- wellbore tortuosity,
- hole cleaning,
- motor condition,
- and other operational differences.
This is particularly important when building drilling roadmaps from offsets. It is tempting to identify the fastest offset, retrieve its WOB and RPM, and call those values the optimum. But the operating point that worked on one well does not exist independently of the rest of the system. Its outcome depended on:
- the formation,
- the BHA,
- the bit,
- the hole condition,
- drilling history,
- hydraulics,
- directional behavior,
- and the current condition of the equipment.
SPE-186166 concluded that optimal WOB-RPM regions could vary substantially even among wells on the same pad.[1] The implication is significant: Offset-well parameters are a starting point, not a universal optimum. Real-time evidence from the current well still matters.
Account for the rest of the well
Drilling efficiency also extends beyond the immediate mechanics at the bit.
Wellbore quality. SPE-196020 examined more than 300 lateral BHA runs and used a tortuosity index to add a quantitative measure of wellbore quality to conventional performance measures.[2]
The paper explicitly notes that traditional metrics such as ROP, total days and number of runs do not fully capture the quality of the wellbore delivered. The highest-ROP well is therefore not necessarily the best well from a later well-construction or completion perspective.[2] Excessive tortuosity can contribute to:
- increased and erratic torque and drag,
- poorer hole cleaning,
- casing and liner-running difficulty,
- and other operational complications.
ROP is important. But ROP and wellbore quality should not be treated as interchangeable objectives.
Hole cleaning. Higher ROP also means a greater rate of cuttings generation.
That does not mean high ROP is inherently bad for hole cleaning. It means the hydraulic and mechanical system must be capable of transporting the additional solids being generated. SPE-204125 describes hole cleaning as a process influenced by circulation rate, bit hydraulics, hole angle, pipe movement, rotation and the history of previous operations.[3] If ROP is increased while circulation capability remains unchanged, the balance between cuttings generation and transport can change. A parameter change that improves instantaneous ROP should therefore still be evaluated in the broader context of hole condition.
Bit condition. Changes in ROP can result from formation, dysfunction, or PDC wear and should not automatically be interpreted as bit damage.[4] The reverse is also important: a bit can continue making acceptable footage while its mechanical condition deteriorates. Performance surveillance therefore benefits from examining ROP together with WOB, RPM, depth of cut, torque behavior, and longer-term trends. The operational goal is rarely the highest ROP achievable for the next thirty seconds. A more useful objective is:
The highest sustainable drilling performance that maintains acceptable mechanical behavior, hole condition and wellbore quality.
That shifts the optimization problem away from a single variable. Instead of:
Maximize ROP.
the practical objective becomes something more like:
Increase ROP while keeping the system out of significant dysfunction and maintaining acceptable hole and equipment conditions.
That is a more difficult problem. It is also much closer to the actual engineering objective.
Benchmark a repeatable operating envelope
Historical offset data remains extremely valuable. But instead of asking:
What was the highest ROP on the offset?
a more useful analysis asks:
Under what operating conditions was high ROP repeatedly achieved without significant dysfunction?
Then:
Did those conditions also produce acceptable bit life, hole condition and wellbore quality?
That creates a much stronger benchmark. It turns the offset from a list of parameter values into evidence about an operating envelope.
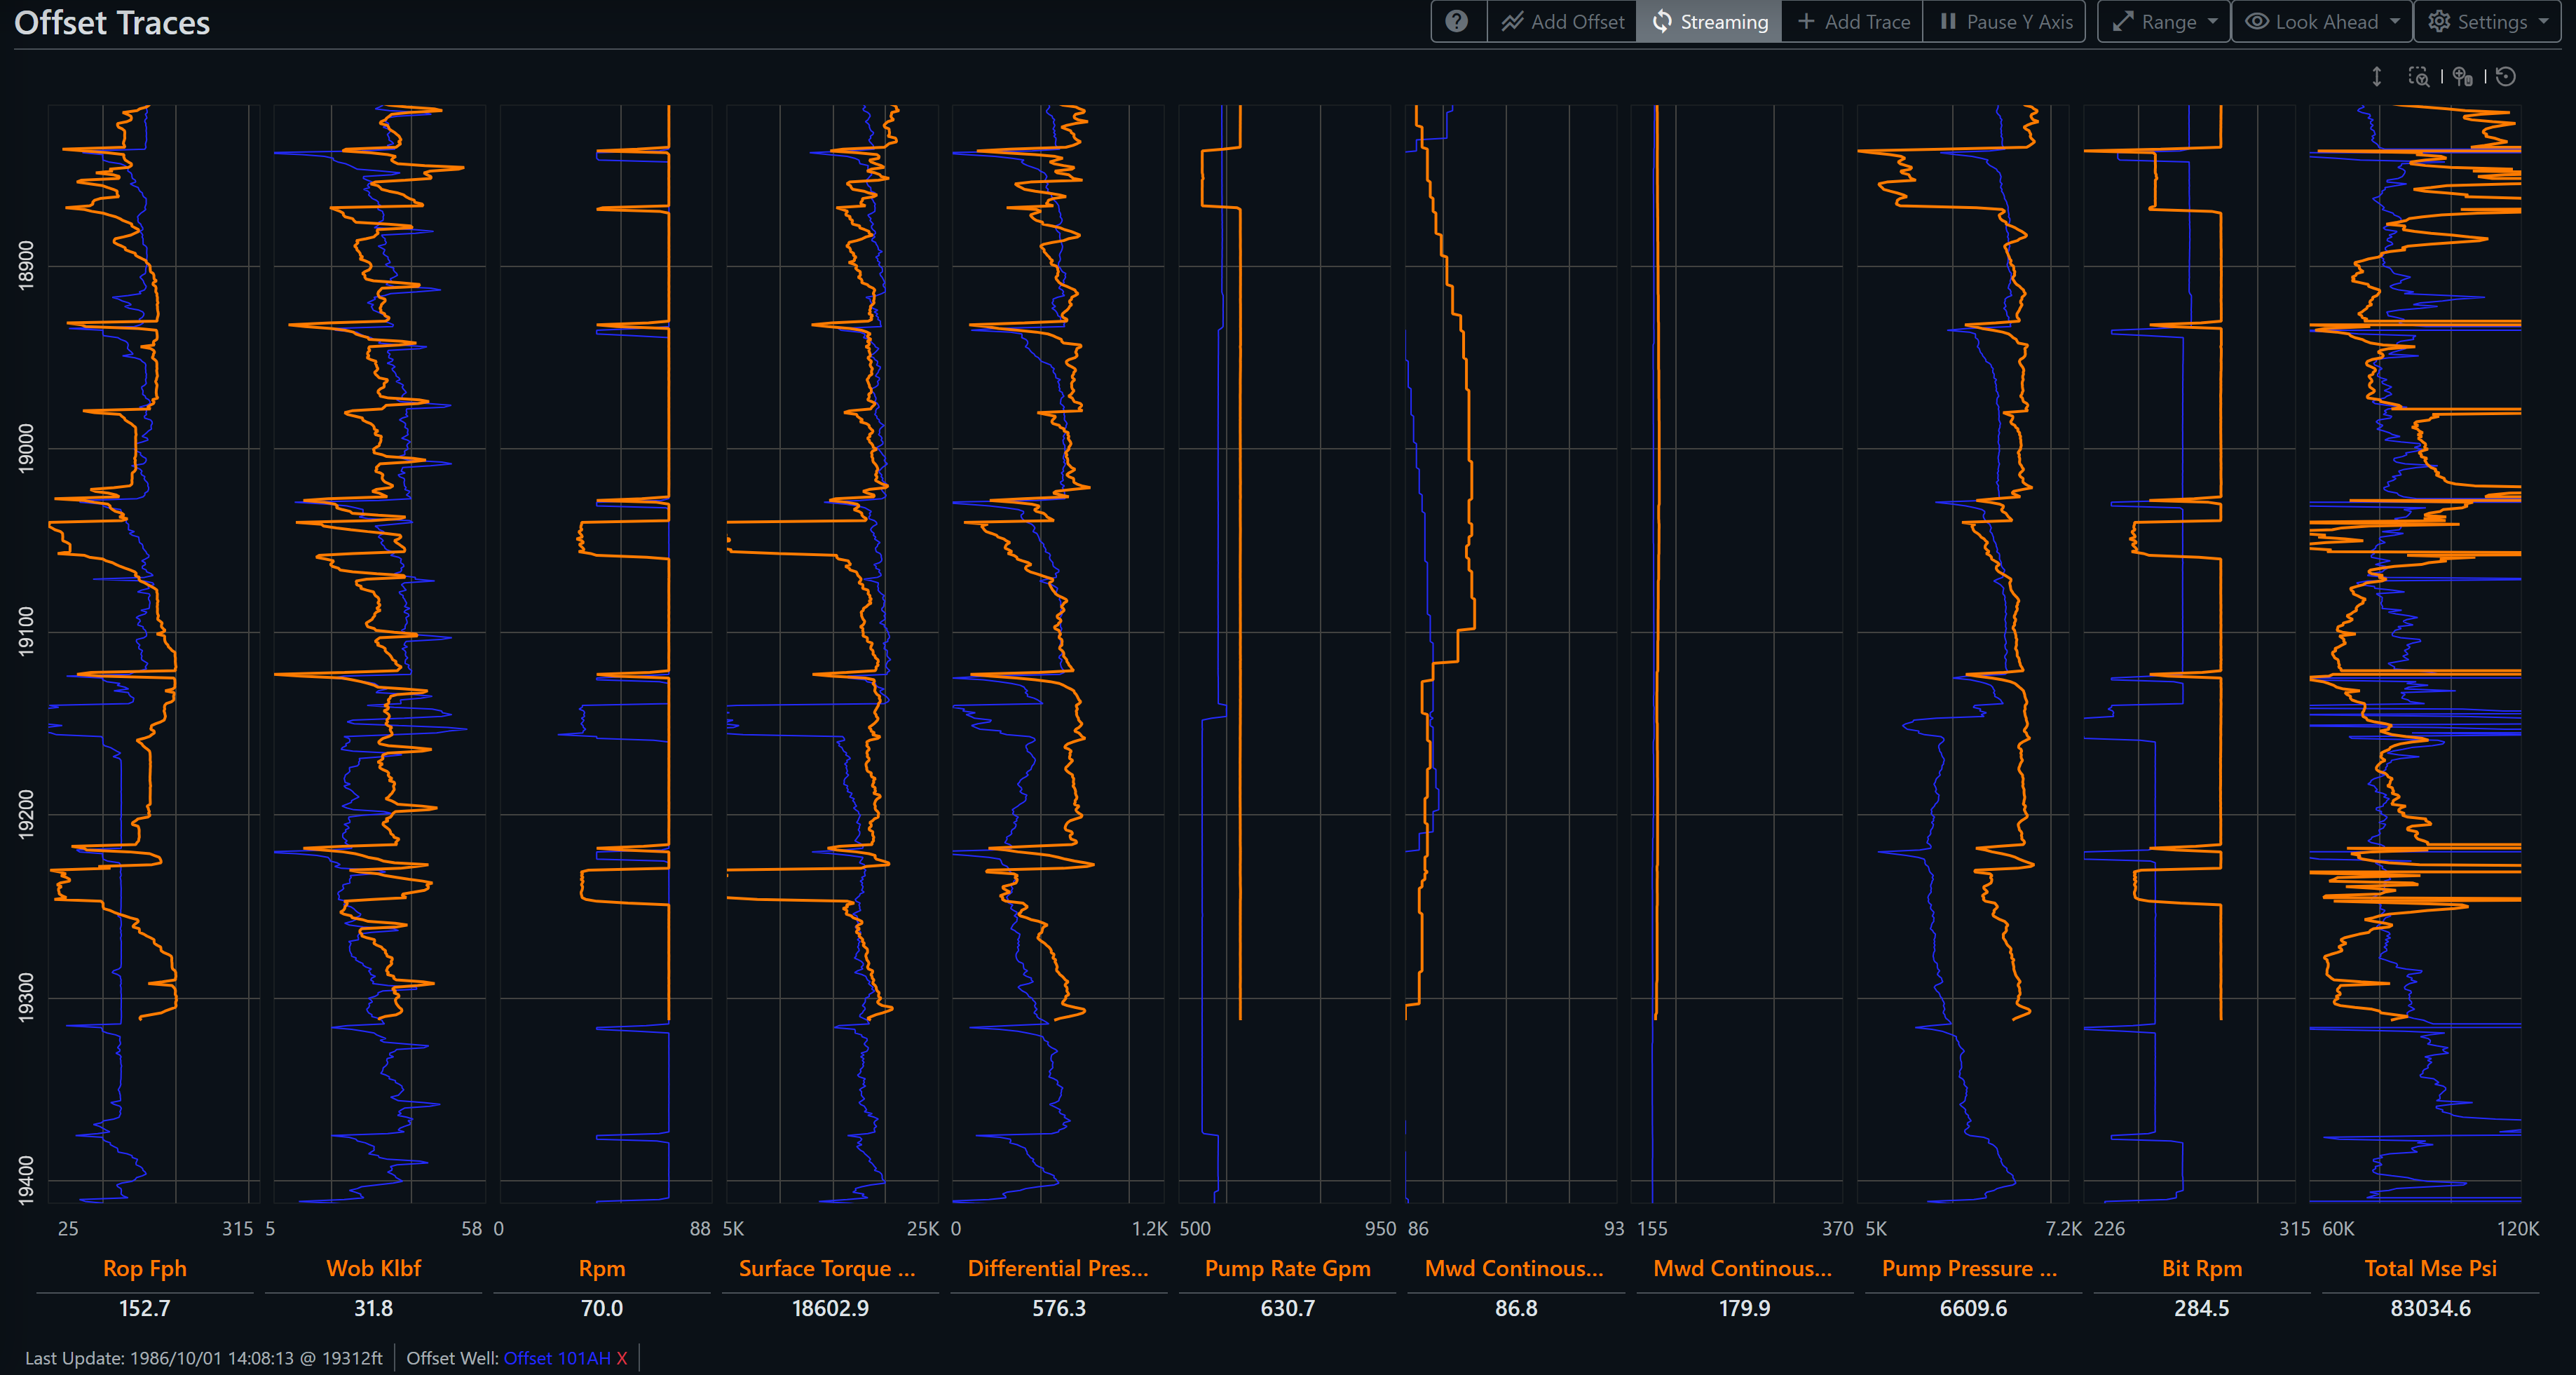
Depth-aligned traces compare the current well (orange) with the offset well (blue). Despite broadly similar WOB, RPM, flow rate, and pressure, the current well achieved higher ROP and lower total MSE with a different bit design, showing why offset benchmarking should evaluate the operating system, not ROP alone.
Related technical resources
- Mechanical Specific Energy: Powerful Metric, Incomplete Diagnosis
- The Nonlinear WOB–RPM Performance Landscape
- The Average Trap: Comparing Drilling Performance With Distributions
References
-
Ambrus, A., Ashok, P., Chintapalli, A., Ramos, D., Behounek, M., Thetford, T. S., and Nelson, B. A Novel Probabilistic Rig Based Drilling Optimization Index to Improve Drilling Performance. SPE-186166-MS, SPE Offshore Europe Conference & Exhibition, Aberdeen, United Kingdom, 2017.
-
Shahri, M., James, M., Vasicek, A., De Napoli, R., White, M., Behounek, M., D'Angelo, J., Ashok, P., and van Oort, E. Case Studies: Optimizing BHA Performance by Leveraging Data and Advanced Modeling. SPE-196020-MS, SPE Annual Technical Conference and Exhibition, Calgary, Alberta, Canada, 2019.
-
Ashok, P., D'Angelo, J., Ramos, D., Yi, M., Thetford, T., Younk, N., Bohlander, S., Shahri, M., and Behounek, M. A Probabilistic Belief System to Track the Cleanliness of a Hole in Real-time. SPE-204125, SPE/IADC Drilling Conference, 2021.
-
Witt-Doerring, Y., Pastusek, P., Ashok, P., and van Oort, E. Quantifying PDC Bit Wear in Real-Time and Establishing an Effective Bit Pull Criterion Using Surface Sensors. SPE-205844-MS, SPE Annual Technical Conference and Exhibition, 2021.