Why Rig-State Classification Is Foundational to Real-Time Drilling Analytics
Raw sensor channels describe what the rig is measuring. Rig-state classification adds the operational context needed to determine what those measurements mean.
Suppose surface torque is 12,000 ft-lbf.
Is that high?
There is no useful answer yet.
If the rig is rotary drilling, the measurement may contain information about bit and drillstring behavior.
If the string is rotating off bottom, the same torque may be useful for estimating friction.
If the rig is reaming, the mechanical interpretation changes again.
If the top drive is not rotating and the reported torque is merely residual sensor noise, it may have almost no engineering significance.
The number did not change.
The operation did.
This is one of the fundamental challenges of real-time drilling analytics.
Rig data arrives as measurements:
- hook load,
- block position,
- bit depth,
- hole depth,
- surface RPM,
- torque,
- standpipe pressure,
- pump strokes,
- flow,
- ROP.
But engineers do not normally reason in isolated measurements.
They reason in operations:
- rotary drilling,
- slide drilling,
- reaming,
- circulating,
- tripping in,
- tripping out,
- connections,
- static periods.
Rig-state classification is the process that connects those two worlds.
It turns:
pumps = on, RPM = zero, bit depth = changing
into an operational interpretation.
And once that interpretation exists, the rest of the analytics can begin.

Rig-state classification converts raw traces into operational context and routes each interval to the appropriate engineering analytics.
A Sensor Reading Does Not Contain Its Own Meaning
Consider hook load.
A hook-load value of 400 klbf may represent:
- the string being picked up,
- the string being slacked off,
- static suspended weight,
- a connection,
- backreaming,
- or another mechanical condition.
The value alone does not identify which one occurred.
Now consider ROP.
A positive ROP channel may suggest drilling.
But depending on how the EDR calculates and filters that channel, it may continue reporting values during brief transitions.
Bit depth can also change without new hole being created.
For example:
- reaming into existing hole,
- tripping,
- working the string.
This creates an important distinction:
Movement of the bit is not the same thing as drilling.
Likewise:
Pumps on is not the same thing as circulating for the same purpose.
And:
Pipe rotation is not the same thing as rotary drilling.
The meaning comes from the combination of measurements.
Rig State Is a Derived Engineering Variable
There is usually no single sensor called:
Rig State
Instead, operational state is inferred from patterns among several channels.
For example, a classification system might consider relationships among:
- bit depth,
- hole depth,
- block movement,
- hook load,
- surface RPM,
- pump activity,
- standpipe pressure,
- ROP.
The exact implementation can vary.
But conceptually the problem is similar to what an experienced engineer does while watching traces.
If:
- bit depth is near hole depth,
- hole depth is increasing,
- pumps are on,
- surface rotation is present,
the evidence is consistent with rotary drilling.
If hole depth is increasing but surface RPM is absent while a mud motor is active, the operation may instead be slide drilling.
If:
- bit depth is changing,
- hole depth is not,
- pumps and rotation are active,
the system may be observing reaming rather than drilling.
The important point is not a specific threshold set.
It is that multiple measurements are interpreted together to create an operational label.
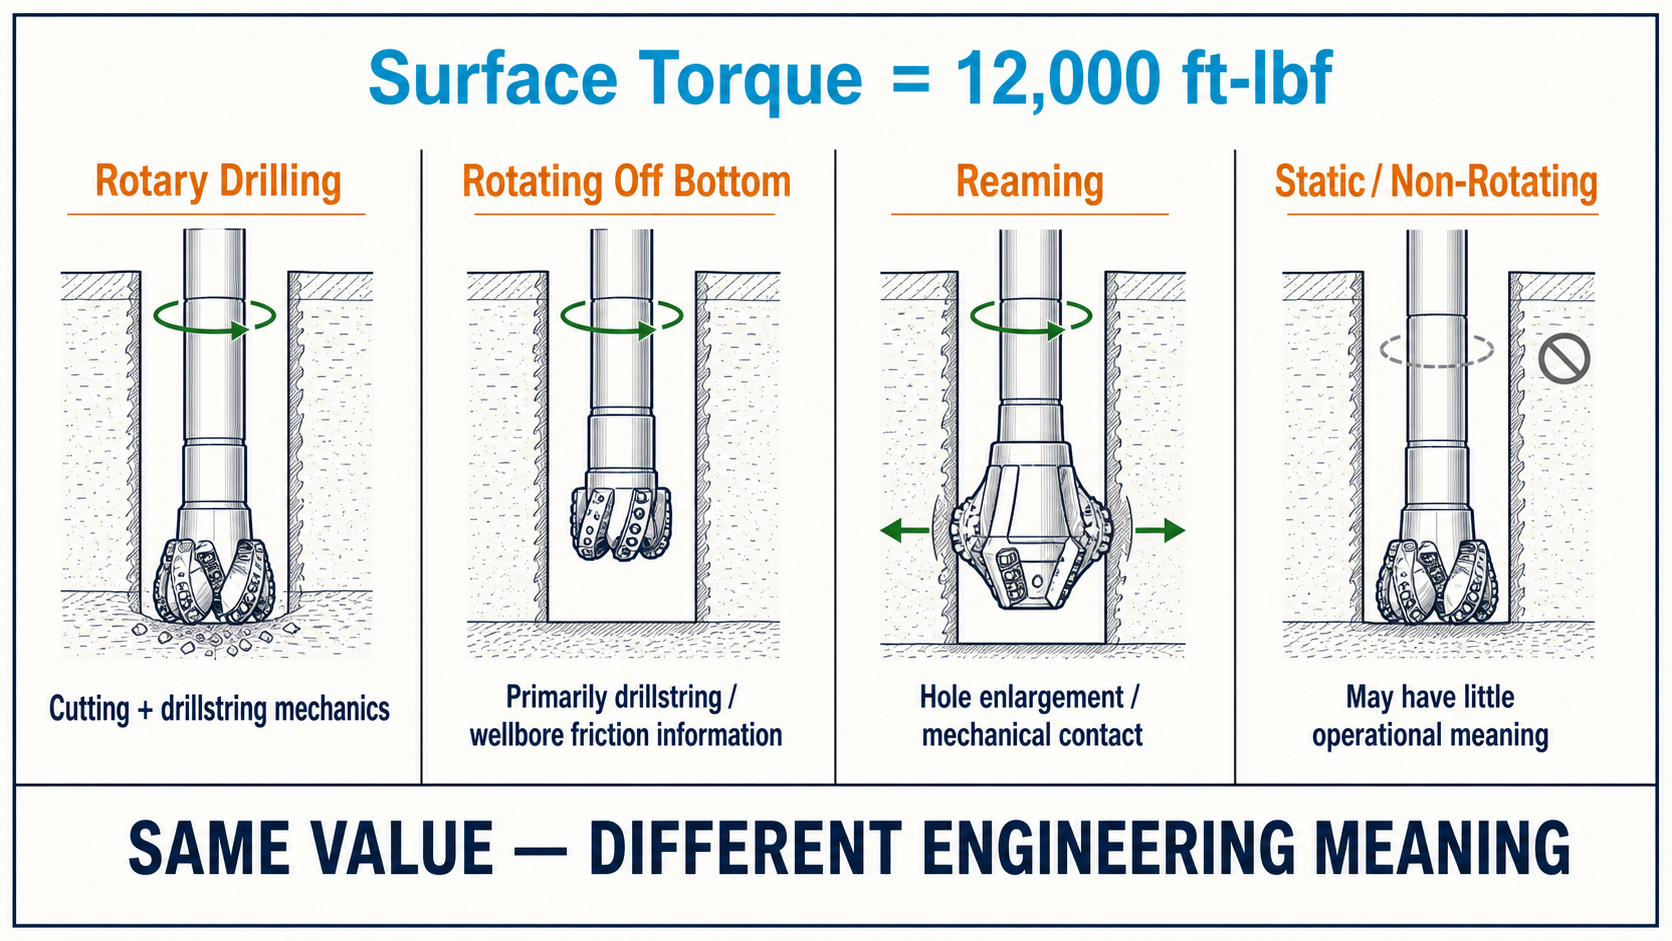
The same surface-torque value supports different engineering interpretations depending on the operation.
Why Drilling and Reaming Must Be Separated
This distinction seems obvious operationally.
It becomes surprisingly important in analytics.
Suppose a 30-minute interval contains:
- 20 minutes of rotary drilling,
- 5 minutes of reaming,
- 5 minutes of off-bottom circulation.
Now calculate:
$$ Average\ ROP $$
over the entire 30-minute interval.
The result is no longer a clean drilling-performance metric.
Torque is similarly affected.
Torque while drilling includes the mechanical response of the cutting process plus drillstring friction.
Torque while rotating off bottom removes the cutting contribution and may instead provide information about drillstring/wellbore friction.
That distinction is valuable enough that SPE-191426 specifically used rig-state classification to identify measurements corresponding to:
- pick-up,
- slack-off,
- and rotating off bottom
before feeding those measurements into real-time torque-and-drag analysis.[1]
In other words:
The model did not merely need hook load and torque.
It needed hook load and torque from the correct operation.
Analytics Often Require State-Specific Data
Once rig state is available, the same dataset can be partitioned into mechanically meaningful subsets.
Drilling performance
Use data identified as actual drilling.
Exclude:
- reaming,
- circulation,
- connections,
- tripping.
Torque and drag
Use:
- pick-up measurements,
- slack-off measurements,
- rotating-off-bottom measurements
for different calibration purposes.
Hole cleaning
Interpret:
- drilling,
- static time,
- reaming,
- pipe rotation,
- circulation without drilling
as distinct forms of evidence.
Connection analysis
Identify transitions between:
- drilling,
- off-bottom activity,
- slips,
- and return to drilling.
Dysfunction surveillance
Only activate certain calculations when the operating state physically supports the interpretation.
This means rig state is not simply another chart trace.
It acts more like a routing variable.
It determines which analytics should receive each portion of the data.
Rig state routes each interval to the engineering calculations that are physically appropriate.
Mixing States Produces Misleading Statistics
Imagine evaluating WOB performance over one hour.
During that hour:
- 38 minutes were drilling,
- 8 minutes were connections,
- 6 minutes were reaming,
- 8 minutes were off bottom.
If all data are included, median WOB might be:
18 klbf
But while actually drilling, median WOB may have been:
32 klbf
Which value represents the drilling practice?
Clearly the second.
The first number describes the entire hour—not the drilling process.
The same contamination can occur with:
- ROP,
- torque,
- differential pressure,
- RPM,
- flow,
- MSE,
- connection time,
- trip speed.
This is one reason sophisticated-looking statistics can still be wrong.
A percentile calculated over the wrong operational population is still the wrong answer.
Before calculating:
- average,
- median,
- P10,
- P50,
- P90,
the first question should often be:
Which operational states belong in this population?
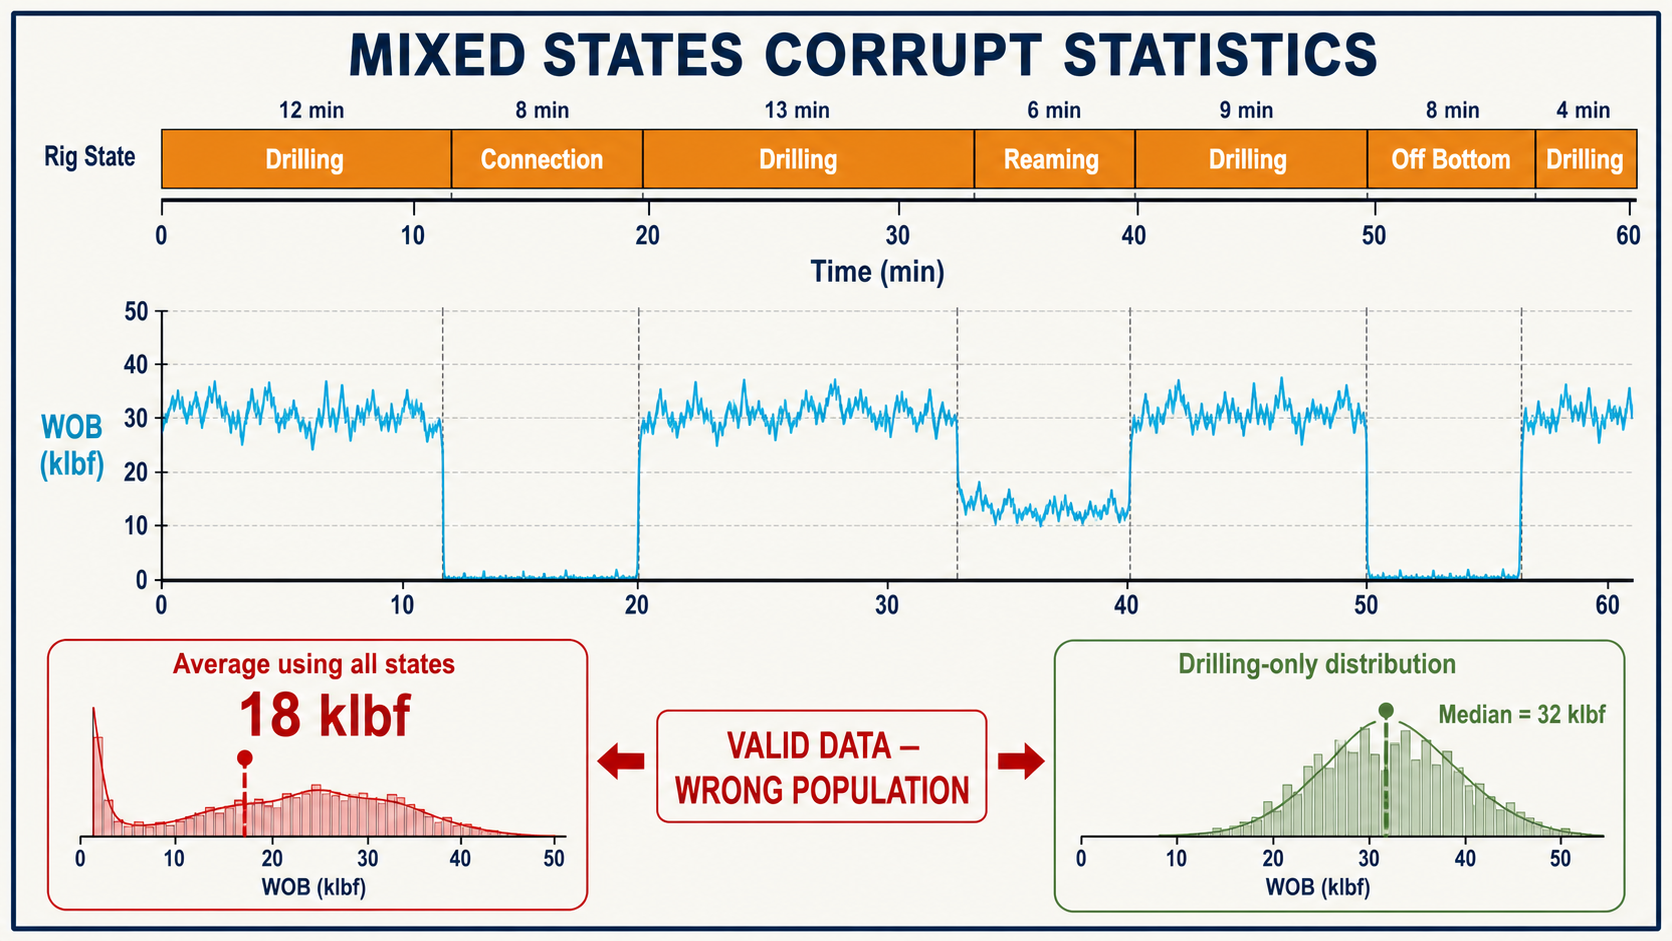
All values may be valid, yet mixed-state statistics still describe the wrong operational population.
State Classification Is Part of Data Cleaning
Data cleaning is often thought of as:
- removing nulls,
- removing outliers,
- correcting bad timestamps,
- identifying sensor faults.
But operational filtering is another form of cleaning.
Suppose the question is:
What was rotary drilling MSE in this formation?
The reaming data may be perfectly valid sensor data.
Nothing is wrong with it.
It is simply wrong for the question being asked.
That distinction is important.
There are at least three forms of irrelevant data:
Invalid data
The sensor is wrong.
Misaligned data
The measurement is associated with the wrong time or context.
Operationally irrelevant data
The measurement is valid, but it was generated during a different activity.
Rig-state classification primarily addresses the third category.
A good analytics pipeline needs all three.
The Same Measurement Can Become Useful Again in Another State
Operational filtering does not mean discarded data has no value.
A torque measurement excluded from an ROP-optimization calculation may be extremely valuable for torque-and-drag calibration.
A static period excluded from drilling-performance analysis may be important for hole-cleaning surveillance.
A connection interval excluded from drilling MSE may become the basis of a connection-time KPI.
The data is not necessarily bad.
Its meaning changes with state.
This is a more useful way to think about real-time drilling data:
Every operation generates evidence for a different engineering question.
Rig State Helps Physical Models Know When They Apply
Consider a real-time hydraulic model.
Pressure behavior during steady drilling may be compared with expected circulating pressure to identify hydraulic changes.
But while pumps are:
- ramping up,
- ramping down,
- off,
- or operating during a different rig activity,
the same comparison may not be meaningful.
SPE-191797 specifically notes that applications of a real-time hydraulic model require knowledge of rig state—such as drilling, tripping, or circulation—in addition to real-time channels and contextual information.[2]
That is a significant point.
The physical equations may remain valid.
But the boundary conditions have changed.
A real-time model therefore needs to know not only:
What are the inputs?
but also:
Is the system currently in the operating condition this calculation assumes?
:contentReference[oaicite:2]{index=2}

A physically correct model can still mislead when it is applied outside its applicable operating state.
Rig State Can Prevent False Event Detection
Suppose standpipe pressure falls sharply.
If this happens during stable drilling at constant pump rate, it may deserve investigation.
If it happens because the rig just began staging the pumps down for a connection, the interpretation is completely different.
Similarly:
- hook load increasing during trip out,
- torque rising while reaming,
- block movement during a connection,
may be expected behavior.
An event detector that ignores operational state can classify normal transitions as anomalies.
The event itself is not unusual.
It is only unusual for the wrong state.
This creates a simple rule:
$$ Anomaly \neq Unusual\ Value $$
A more useful concept is:
$$ Anomaly = Unusual\ Behavior \mid Current\ Operational\ State $$
That conditional interpretation is one of the foundations of reliable real-time surveillance.
State Transitions Are Often More Informative Than States
There is another layer.
Sometimes the interesting part is not:
what state are we in?
It is:
how did we move from one state to another?
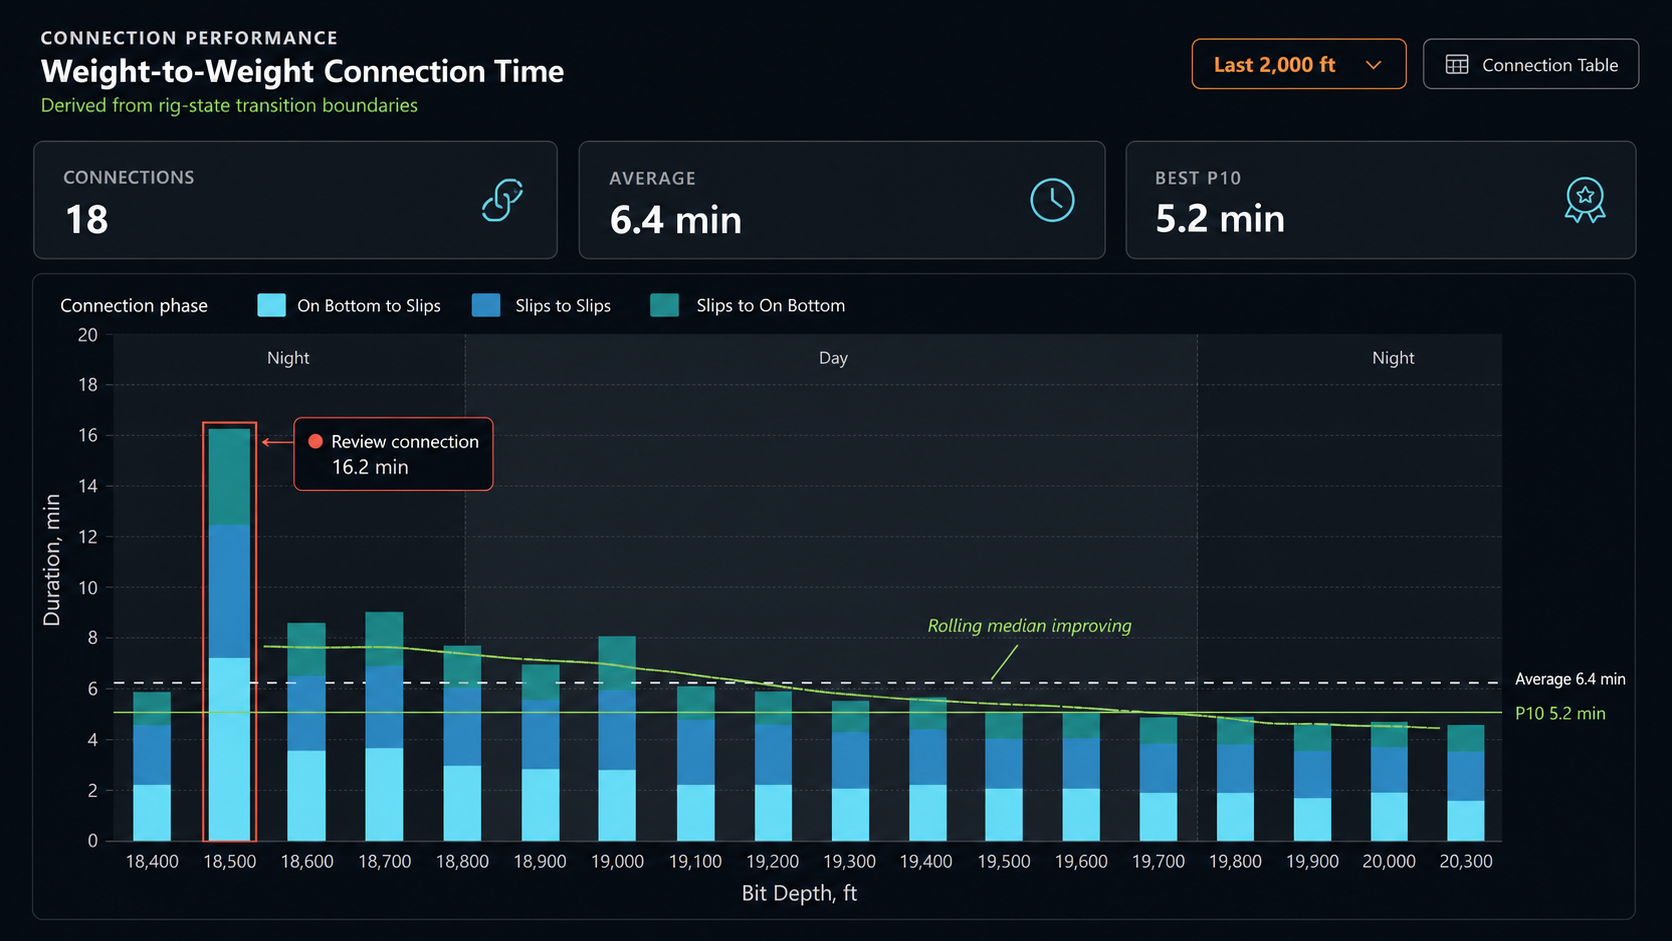
A drilling connection is a sequence.
Conceptually:
Drilling
→ come off bottom
→ prepare for connection
→ slips / connection activity
→ come out of slips
→ return to bottom
→ resume drilling
Different portions of that transition consume time for different reasons.
This allows connection analysis to move beyond one number:
total connection time
and examine where the time is actually being spent.
Likewise, a trip consists of repeated cycles:
movement
→ slips
→ connection
→ movement.
Operational transitions therefore provide the event boundaries needed to calculate repeatable performance metrics.

Rig-state transition boundaries make repeatable connection-performance tracking possible.
Rig-State Errors Propagate Downstream
Suppose ten minutes of reaming are incorrectly classified as drilling.
What happens?
Potential consequences include:
ROP statistics
Average drilling ROP is reduced because footage is not increasing normally.
MSE
The calculation may interpret mechanically different data as cutting performance.
Slide/rotate percentages
The footage or time allocation becomes incorrect.
Connection timing
State boundaries may shift.
Hole cleaning
Reaming activity that should count as proactive pipe movement may disappear from the event history.
Torque and drag
Hook-load points may be assigned to an inappropriate mechanical condition.
The rig-state error itself may seem small.
But the error is multiplied across every downstream calculation that trusts the classification.
This is why operational-state classification should be treated as infrastructure, not merely a visualization feature.

A single misclassified interval can contaminate multiple downstream engineering KPIs.
Classification Should Be Allowed to Be Uncertain
A common temptation in classification systems is to require every second of data to have a named state.
That can create false precision.
There are situations where:
- sensors are missing,
- channels disagree,
- transitions are occurring,
- the rig is performing an unusual hybrid activity,
- or the available evidence simply does not support a unique interpretation.
In those cases, an unknown or unclassified state can be technically preferable.
The downstream analytics can then:
- exclude the uncertain interval,
- reduce confidence,
- or request more context.
This is better than confidently labeling the interval incorrectly.
The principle is the same one we encountered in sensor validation and washout diagnosis:
uncertainty is information.
A mature system should preserve it.
Different Rigs Can Express the Same Operation Differently
Operational-state classification becomes even more difficult across a fleet.
One rig may provide:
- direct slips status,
- accurate block position,
- high-frequency pump status.
Another may provide only:
- hook load,
- bit depth,
- RPM,
- SPM.
Channel names may differ.
Units may differ.
Sampling frequency may differ.
Some signals may be unavailable entirely.
The classification logic therefore needs an abstraction layer between:
rig-specific tags
and
engineering concepts.
SPE/IADC-184743 describes a data-aggregation architecture that mapped rig-specific sensor tags into a general model so the system did not have to be redesigned for each rig configuration.[3] :contentReference[oaicite:3]{index=3}
This is an important data-engineering challenge.
Fleet-wide analytics require standardized meaning, not merely standardized column names.
Human Interfaces Also Benefit From Knowing the State
Rig-state classification is useful even when no advanced model is running.
The information an engineer wants during drilling is not the same information needed during tripping.
SPE/IADC-184743 describes operation-specific displays and explicitly notes that data relevant while drilling may be of limited use while tripping. Preconfigured views reduced the workload required to repeatedly reconfigure the display as the operation changed.[3]
The same principle applies to modern dashboards.
During drilling
Prioritize:
- ROP,
- WOB,
- RPM,
- torque,
- differential pressure,
- MSE,
- steering information.
During tripping
Prioritize:
- hook load,
- bit depth,
- trip speed,
- modeled drag,
- overpull/underpull,
- pumps and rotation.
During circulation
Prioritize:
- flow,
- standpipe pressure,
- returns,
- pit volume,
- hydraulic indicators.
Rig state can therefore drive not only calculations but information hierarchy.
:contentReference[oaicite:4]{index=4}

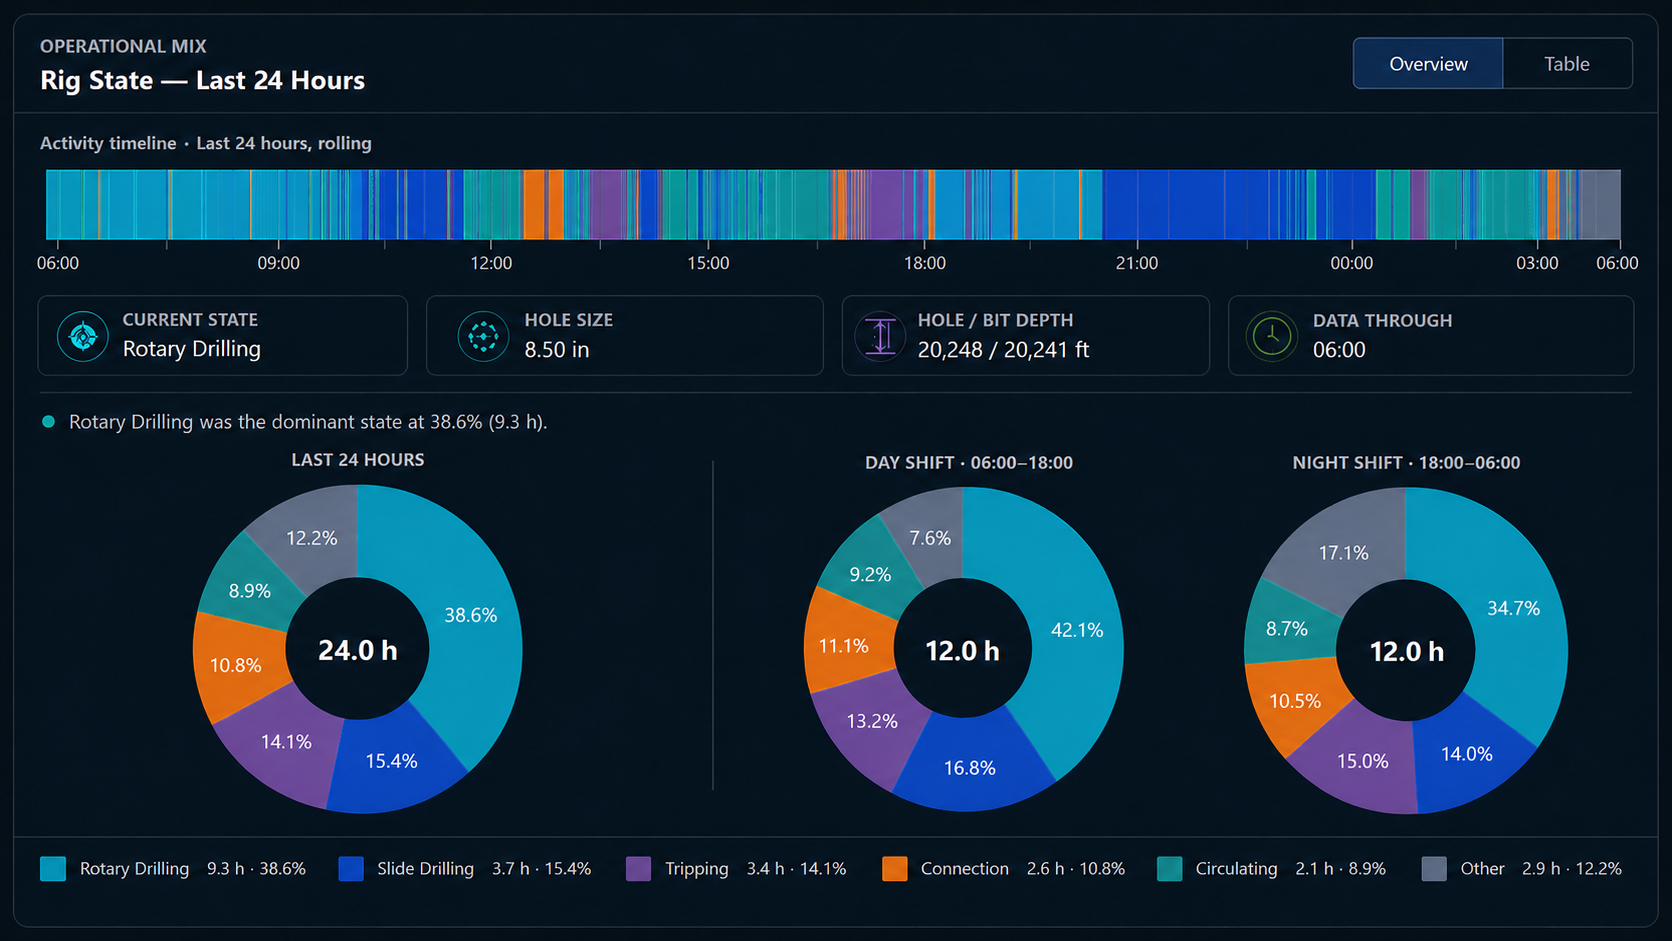
A rolling operational-mix view turns the classified state stream into a quick 24-hour and shift-level summary.
A Practical Example
Consider the following synthetic ten-minute sequence.
14:00–14:04 — Rotary drilling
- hole depth increasing,
- bit near bottom,
- pumps on,
- 120 RPM,
- steady torque,
- ROP around 180 ft/hr.
Appropriate analytics:
- ROP,
- MSE,
- drilling dysfunction,
- parameter performance.
14:04–14:05 — Off bottom
The driller comes off bottom before a connection.
ROP should no longer contribute to drilling-performance statistics.
14:05–14:07 — Connection
Bit depth is static.
Rotation stops.
Pump activity changes.
This interval belongs to flat-time / connection analysis.
14:07–14:08 — Circulation / preparation
Pumps are staged.
The string may rotate briefly.
Pressure transients here should not be interpreted using the same assumptions as steady drilling.
14:08–14:10 — Return to bottom and resume drilling
The system transitions back into drilling.
Now the ROP and MSE population begins again.
A time-series plot sees ten minutes of continuous sensor data.
A rig-state-aware system sees five different operational segments.
That distinction is the foundation of meaningful automated analysis.
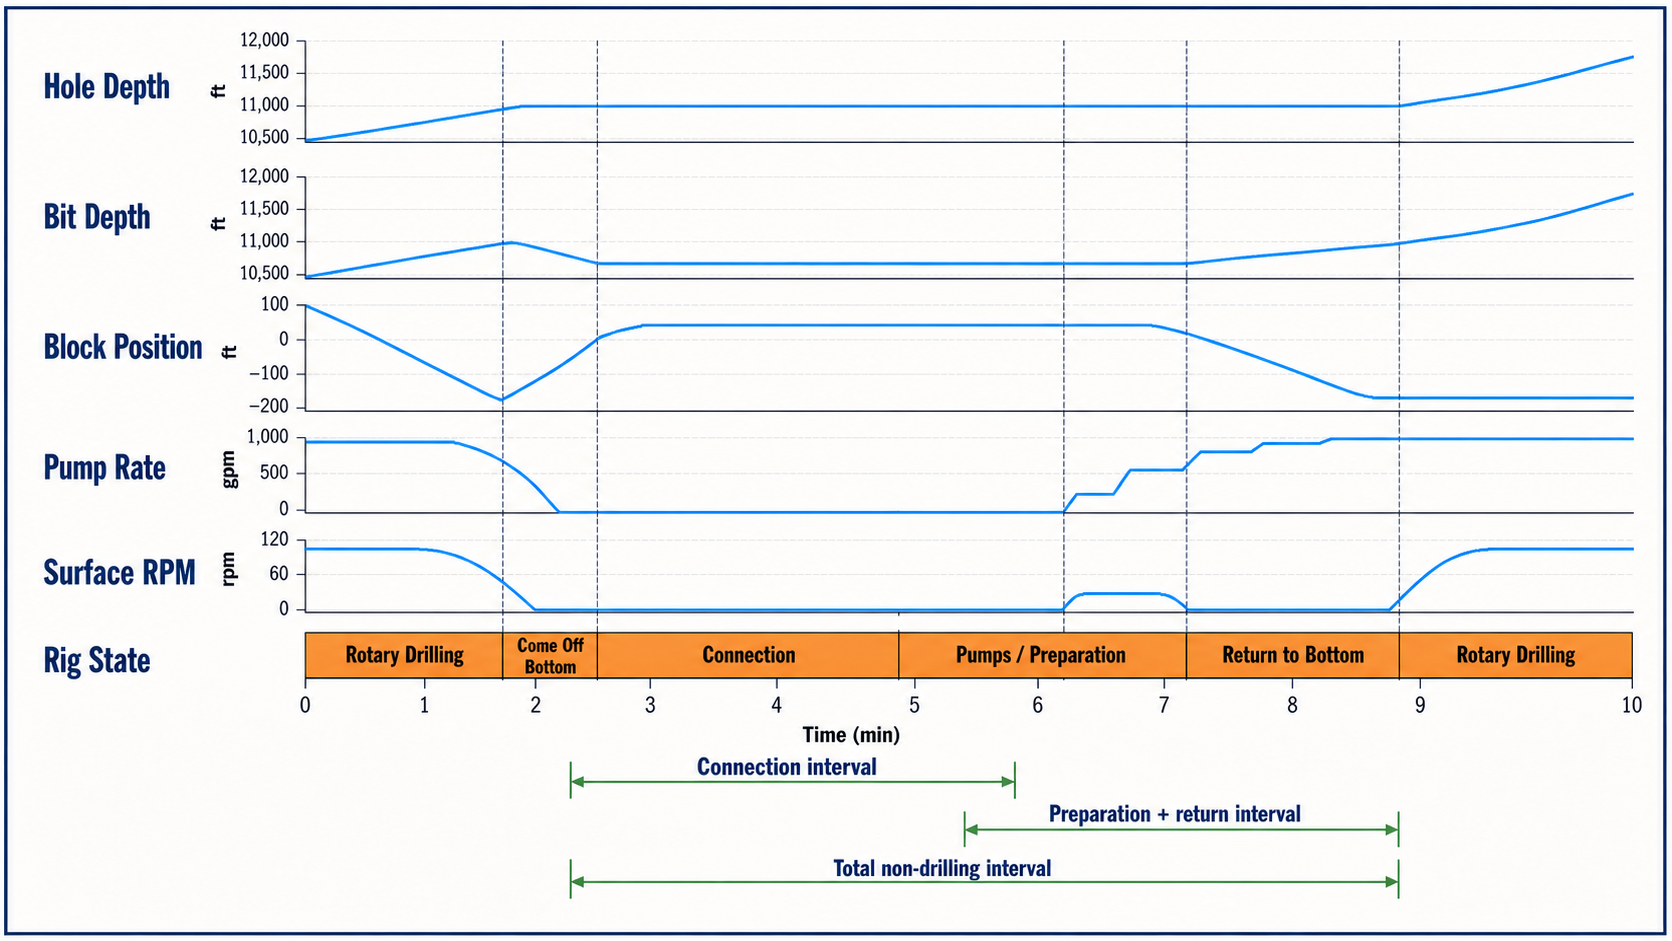
Aligned synthetic traces show the transition from drilling through a connection and back to bottom.
Rig State Creates the Semantic Layer
Raw drilling data is largely syntactic.
It tells us:
- this channel is 120,
- that channel is 4,500,
- bit depth changed by 2 ft.
Contextual data adds physical meaning:
- the BHA,
- the mud,
- the well geometry.
Rig state adds operational meaning:
- drilling,
- tripping,
- reaming,
- connecting.
That creates a useful hierarchy:
Layer 1 — Measurements
What did the sensors record?
Layer 2 — Data quality
Can the measurements be trusted?
Layer 3 — Context
What physical system produced them?
Layer 4 — Rig state
What operation was being performed?
Layer 5 — Engineering analytics
What does the behavior mean?
Layer 6 — Decision support
Does the engineer need to act?
Skipping the rig-state layer forces every downstream algorithm to independently rediscover what the rig was doing.
That is inefficient and error-prone.

Engineering decisions depend on successive interpretation layers above the raw measurements.
Rig State Should Be Stored, Not Recalculated Differently Everywhere
Once a robust state classification is generated, there is a strong architectural argument for treating it as a first-class data product.
Otherwise:
- the ROP module defines drilling one way,
- the connection module defines it another way,
- torque-and-drag uses a third rule,
- reporting uses a fourth.
Then the same ten-minute interval can be categorized differently depending on which page is open.
A better architecture is:
one operational interpretation → many downstream consumers
with versioning and traceability when the classifier changes.
This makes KPI definitions reproducible.
If historical results change after classifier improvements, engineers can understand why.
That is particularly important when comparing:
- rigs,
- crews,
- wells,
- time periods,
- or performance before and after operational changes.
Rig-State Classification Is Also an Audit Trail
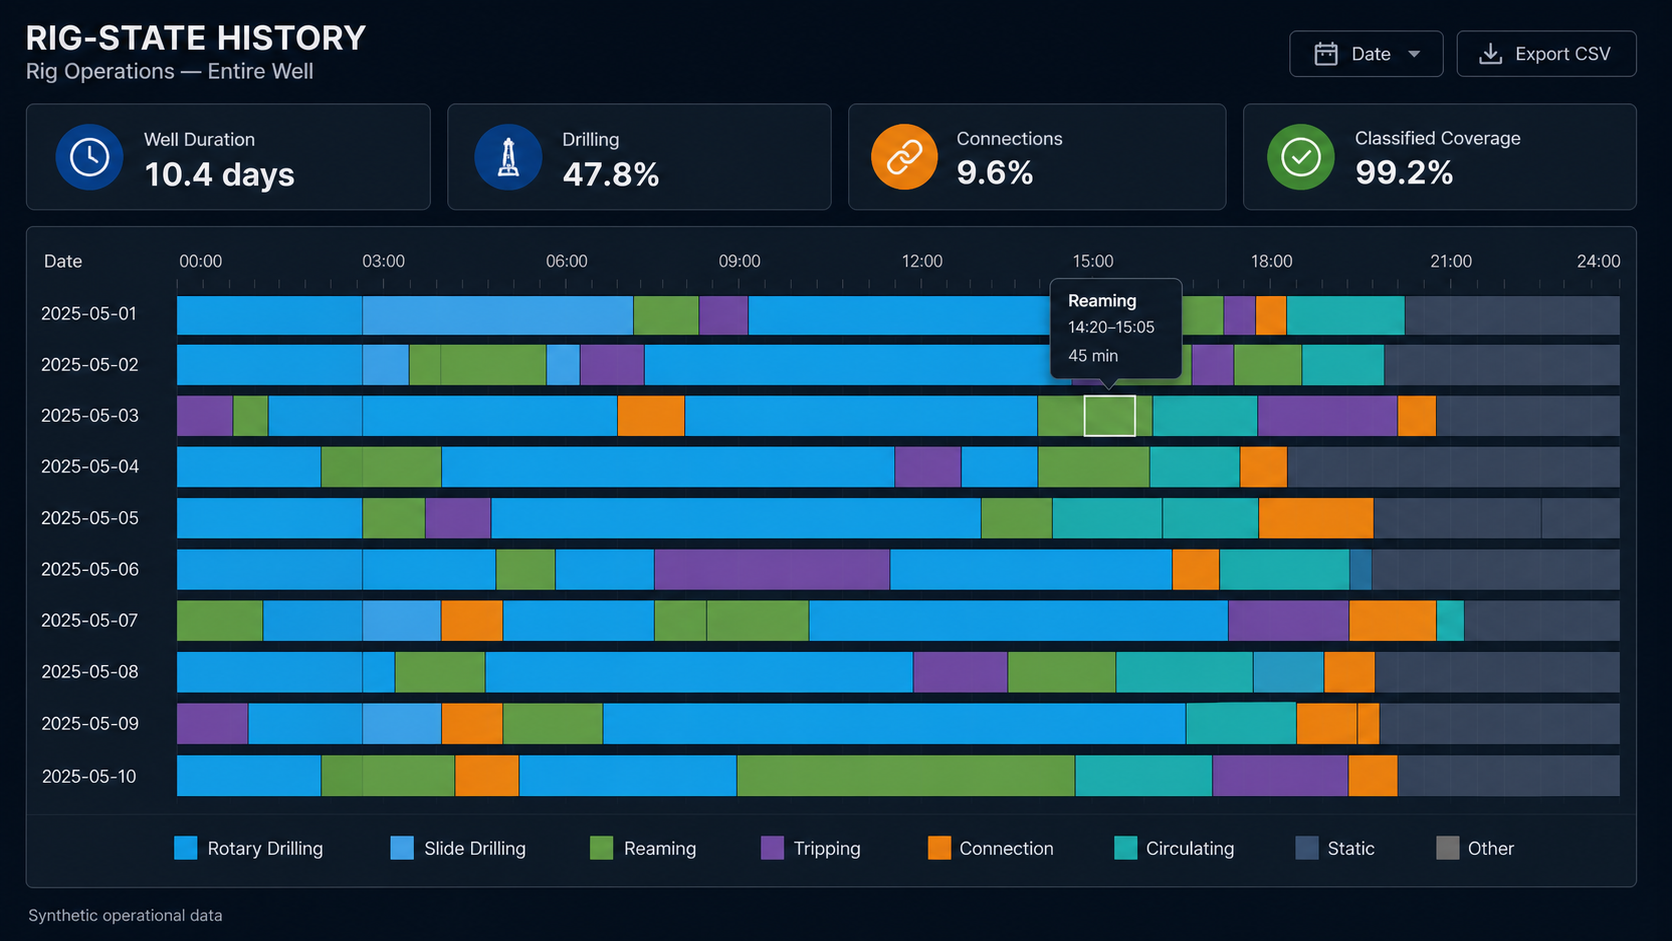
A classified state timeline provides a compressed narrative of the operation.
Instead of scanning dozens of traces, an engineer can quickly see:
- drilling,
- connection,
- drilling,
- reaming,
- static,
- circulation,
- trip out.
That makes it useful for:
- daily operational review,
- NPT/ILT analysis,
- event investigation,
- performance benchmarking,
- automated reporting.
It also helps explain higher-level calculations.
If a performance KPI looks unusual, the engineer can inspect:
Which states contributed to this number?
That traceability builds trust.

An entire-well state history provides a compact operational audit trail.

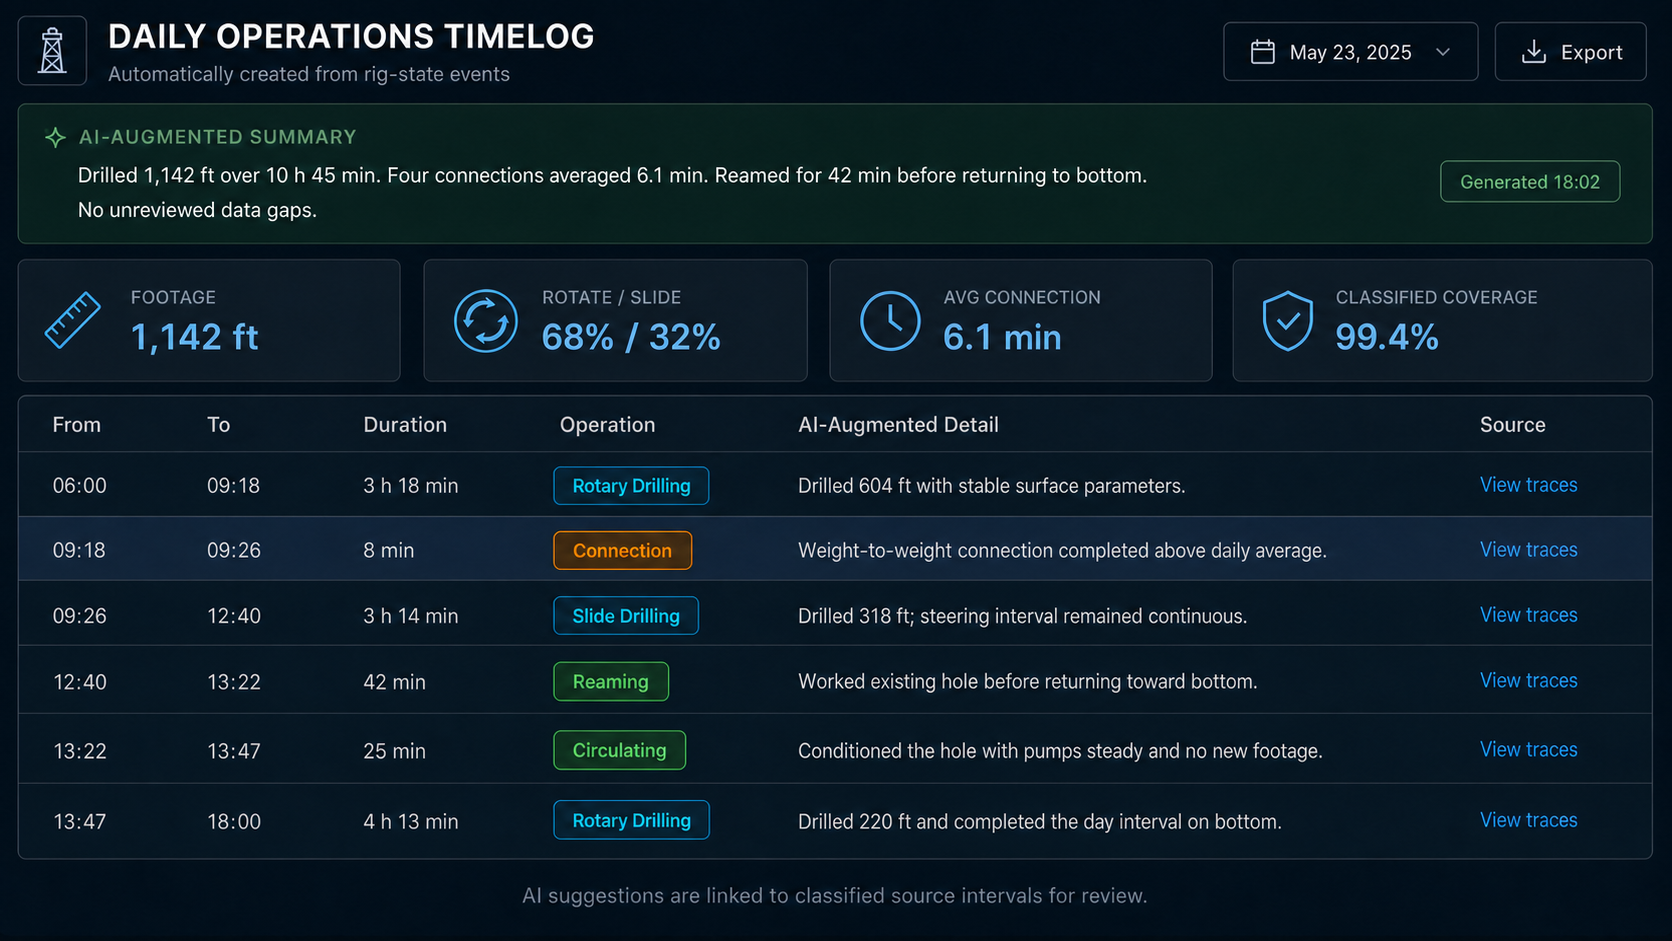
The same classified events can support an automatically assembled daily timelog while keeping each summary linked to its source interval.
The Best Classifier Is Not the One With the Most States
It may be tempting to create extremely detailed labels for every possible rig activity.
More categories are not automatically better.
A useful state taxonomy should be detailed enough to separate operations that matter mechanically or analytically, while remaining:
- stable,
- interpretable,
- generalizable across rigs,
- and supportable by the available sensors.
If two states cannot reliably be distinguished with the existing channels, creating separate labels may add false precision.
The taxonomy should therefore be designed around the downstream engineering question.
For example, distinguishing:
drilling
from
reaming
is highly valuable.
Distinguishing two nearly identical transitional states may not be valuable unless another calculation actually uses that distinction.
From Data Collection to Operational Understanding
A rig can generate millions of sensor samples per day.
That does not mean it generates millions of independent engineering observations.
Most of those samples belong to a smaller sequence of operations.
Rig-state classification compresses the raw stream into something engineers can reason about:
what the rig was doing when the data was generated.
That single layer changes the meaning of nearly every downstream metric.
Without rig state:
- torque is torque,
- hook load is hook load,
- pressure is pressure,
- ROP is ROP.
With rig state:
- drilling torque can be separated from off-bottom torque,
- pick-up weight can be separated from slack-off weight,
- connection time can be isolated,
- reaming can be distinguished from new-hole drilling,
- pressure transients can be interpreted in the correct operation,
- hole-cleaning actions can be recognized as events.
That is why rig-state classification should not be treated as a minor feature of a drilling dashboard.
It is part of the semantic infrastructure of real-time drilling analytics.
Before asking an algorithm:
What does this data mean?
the system first needs to answer:
What was the rig doing when this data was generated?
References
-
Shahri, M., Wilson, T., Thetford, T., Nelson, B., Behounek, M., Ambrus, A., D'Angelo, J., and Ashok, P. Implementation of a Fully Automated Real-Time Torque and Drag Model for Improving Drilling Performance: Case Study. SPE-191426-MS, SPE Annual Technical Conference and Exhibition, Dallas, Texas, 2018.
-
Shahri, M., Kutlu, B., Thetford, T., Nelson, B., Wilson, T., Behounek, M., Ambrus, A., and Ashok, P. Adopting Physical Models in Real-Time Drilling Application: Wellbore Hydraulics. SPE-191797-MS, SPE Liquids-Rich Basins Conference—North America, Midland, Texas, 2018.
-
Behounek, M., Thetford, T., Yang, L., Hofer, E., White, M., Ashok, P., Ambrus, A., and Ramos, D. Human Factors Engineering in the Design and Deployment of a Novel Data Aggregation and Distribution System for Drilling Operations. SPE/IADC-184743-MS, SPE/IADC Drilling Conference and Exhibition, The Hague, Netherlands, 2017.