When Should You Pull a Drilling Bit? A Decision Under Uncertainty

Detecting bit degradation is only the first part of the problem. The actual decision depends on remaining footage, current performance, trip time, expected replacement-bit ROP, drilling dysfunctions, and uncertainty in all of them.

A drilling bit can be performing poorly without being ready to pull.

That distinction matters.

Suppose ROP has fallen substantially over the last several stands. Torque behavior has changed. A bit-performance indicator suggests degradation.

Should the crew trip?

The intuitive answer might be yes.

But now consider that only 500 ft remain to TD.

A bit trip could require many hours to pull out, change the BHA, run back in, circulate, and return to bottom.

Even a badly degraded bit may still reach TD sooner than a brand-new bit can be installed.

Now change only one condition.

Instead of 500 ft remaining, assume 6,000 ft remain.

The same bit condition may lead to a completely different decision.

This is why bit-pull decisions are not fundamentally questions of bit condition.

They are questions of bit condition combined with economics and future performance.

Published work in SPE-205844 and SPE/IADC-214608 provides a useful framework for thinking about this problem using real-time surface drilling data, physics-based indicators, performance trends, trip-time calculations, and scenario analysis.[1][2]

The broader lesson applies well beyond bits:

Detecting a problem and deciding what to do about the problem are two different analytical tasks.

Decision between continuing with a degraded PDC bit and tripping to replace it, based on bit condition, ROP, remaining footage, trip time, and expected replacement-bit performance

Bit condition identifies the problem; remaining footage, trip time, and replacement-bit performance determine whether replacement is worthwhile.

First Question: Is the Bit Actually Degrading?

Before evaluating whether a trip is worthwhile, there is a more fundamental problem:

How do we know that the bit itself is deteriorating?

ROP is often the first symptom noticed.

A bit that previously drilled at 180 ft/hr may now be drilling at 100 ft/hr.

But ROP alone is ambiguous.

ROP can decrease because of:

  • stronger formation,
  • lower WOB,
  • lower RPM,
  • intentional parameter changes,
  • poor hole cleaning,
  • stick-slip,
  • whirl,
  • bit balling,
  • motor performance,
  • or actual cutter degradation.

A declining ROP therefore does not uniquely identify a worn bit.

SPE-205844 examined a PDC wear indicator based on the relationship among WOB, bit RPM, and ROP.[1]

Conceptually, the indicator reflects an important physical idea:

How much loaded cutter travel is required to remove a unit length of formation?

For rotary drilling, the published form can be expressed as:

$$\text{Wear Indicator} = 60 \frac{RPM_{bit}}{ROP} WOB$$

Since depth of cut per revolution is inversely related to $$RPM/ROP$$, the same relationship can also be written conceptually as:

$$\text{Wear Indicator} \propto \frac{WOB}{DOC}$$

where DOC is depth of cut.

The physical interpretation is useful.

If the bit requires more revolutions under load to drill the same footage, the cutters experience greater sliding distance per foot drilled.

That can be consistent with degradation.

But there is an important limitation.

The authors explicitly describe the quantity as a wear indicator, not a direct measurement of physical volumetric wear.[1]

That distinction should not be lost.

Comparison of two PDC drilling intervals with identical 100 ft/hr ROP but different WOB, RPM, depth of cut, and loaded cutter travel

The same ROP can represent very different loaded cutter travel when RPM, WOB, and depth of cut differ.

Why ROP Normalization Matters

Consider two intervals.

Interval A

  • ROP = 100 ft/hr
  • moderate RPM
  • moderate WOB

Interval B

  • ROP = 100 ft/hr
  • substantially higher RPM
  • substantially higher WOB

The ROP is identical.

But the second interval required more rotational movement and more applied load to achieve the same penetration rate.

From a bit-wear perspective, those conditions are not equivalent.

This is one reason the wear approach in SPE-205844 normalizes ROP by operating conditions rather than treating ROP as an isolated performance measure.[1]

The study processed rotary-on-bottom data and calculated stand-level statistics rather than evaluating every instantaneous sample independently.

That approach has practical value.

A stand provides a natural drilling interval long enough to reveal sustained performance behavior while filtering much of the second-to-second variability.

The same general principle applies to many drilling-performance metrics:

Normalize the outcome by the conditions used to produce it.

A Wear Indicator Is Still Not a Diagnosis

Suppose the wear indicator begins rising.

Is the bit definitely wearing out?

No.

The same mathematical behavior can appear when the formation becomes harder.

If ROP falls because formation strength increased while WOB and RPM remain similar, the calculated indicator may also increase.

Drilling dysfunction can create another confounding effect.

Stick-slip, whirl, poor cleaning, or another inefficiency can reduce effective cutting performance even if the cutters themselves have not experienced irreversible damage.

SPE-205844 explicitly cautions that formation and dysfunction can alter the metric independently of bit wear.[1]

This is an important analytical distinction:

Bit wear indicators should be interpreted relative to a baseline and surrounding operational context, not as universal absolute measurements.

Baselines Are More Useful Than Universal Thresholds

A drilling-performance indicator becomes much more informative when there is an established baseline.

Imagine that five previous bit runs through the same formation show a relatively consistent progression:

  • low indicator early in the run,
  • gradual increase with depth,
  • modest rise as normal abrasive wear accumulates.

Now the current bit follows that baseline for several thousand feet and then suddenly departs upward.

That change may be more informative than the absolute numerical value itself.

SPE-205844 observed this type of behavior in hard, abrasive lateral drilling.[1]

Under normal abrasive wear, the wear indicator could increase gradually.

In some failure cases, the indicator departed sharply from that baseline, corresponding with accelerated cutter damage.

The important concept is not the specific threshold from that field.

It is change relative to expected behavior.
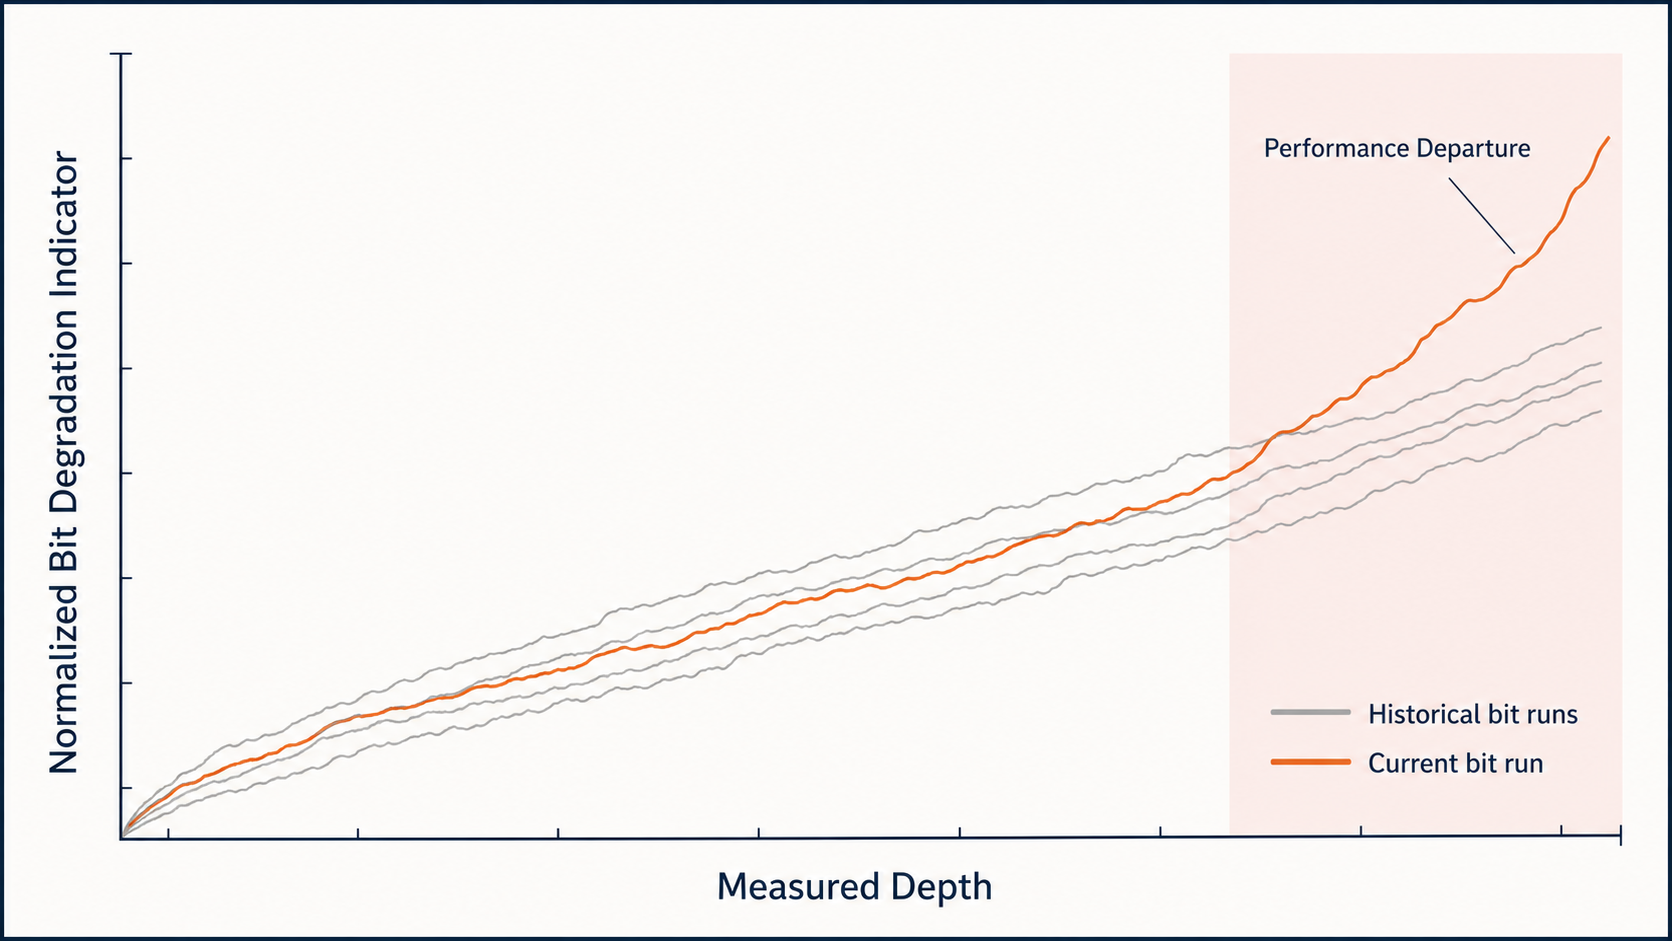
Historical PDC bit runs forming a baseline envelope, with the current bit run departing upward near the end of the interval

Change relative to comparable historical behavior can be more informative than an absolute bit-wear number.

Surface Torque Becomes More Difficult to Interpret in the Lateral

Bit performance becomes more complicated as the well moves toward horizontal.

Surface torque is not the same thing as torque applied at the bit.

Some of the torque measured at surface is consumed overcoming friction along the drillstring.

As the lateral becomes longer, the difference between:

surface torque

and

torque actually reaching the bit

can become substantial.

SPE/IADC-214608 addressed this issue by incorporating an estimate of downhole torque relative to surface torque into its bit-degradation calculation.[2]

The purpose was straightforward:

A bit-performance metric based only on surface torque can misrepresent how much mechanical torque is actually being delivered to the cutters in a long lateral.

This is an example of another recurring drilling-analytics principle:

Surface measurements often become more meaningful when transformed into estimates of downhole conditions using physical models.

That does not make the modeled downhole quantity exact.

It makes it a more relevant approximation of the physical quantity being analyzed.

Long horizontal wellbore showing surface torque reduced by distributed drillstring friction before reaching the PDC bit

In extended laterals, part of the surface torque is consumed along the drillstring, so surface torque alone may not represent the mechanical load applied at the bit.

Bit Condition and Bit Effectiveness Are Related but Different

A bit can show evidence of wear and still be drilling effectively.

Likewise, a bit may be performing poorly for reasons other than permanent cutter damage.

SPE/IADC-214608 therefore combined a degradation metric with recent ROP behavior into a broader assessment of bit effectiveness.[2]

That distinction is useful.

Bit degradation

asks:

Is there evidence consistent with accumulating bit damage?

Bit effectiveness

asks:

Is the current bit still effectively making hole?

The second question brings actual performance back into the decision.

This matters because a pull decision should not be made from a degradation indicator alone.

Suppose degradation has increased somewhat, but ROP remains strong and stable.

That is a different situation from:

  • sustained degradation,
  • falling ROP,
  • and little recovery after parameter adjustments.

The evidence becomes progressively stronger when multiple independent indicators tell the same story.

Before Blaming the Bit, Correct the Dysfunction

This is one of the most important operational safeguards in the published field-deployment work.

When the advisory indicated that bit effectiveness had become poor, the workflow did not immediately say:

Pull the bit.

Instead, the driller was asked to evaluate whether drilling dysfunctions such as:

  • stick-slip,
  • bit balling,
  • whirl,

could be responsible for the poor performance and attempt to correct them first.[2]

That is an important distinction because some poor drilling performance is reversible.

Bit damage is not.

If ROP recovers after reducing a dysfunction, an unnecessary trip may be avoided.

If drilling remains ineffective after the identifiable dysfunction is mitigated, the evidence that the bit itself has reached the end of useful life becomes stronger.

Technical workflow showing reversible drilling dysfunction checks before evaluating PDC bit degradation and bit-pull economics

Poor drilling performance should be tested for reversible causes before it is treated as permanent bit damage and advanced to bit-pull economics.

Detecting a Bad Bit Does Not Mean You Should Pull It

Now we arrive at the central decision.

Suppose the evidence strongly suggests the bit is degraded.

You still do not know whether a trip is worthwhile.

There are two competing time paths.

Option 1: Stay on the current bit

Time to TD depends on:

  • remaining footage,
  • current ROP,
  • expected continued degradation.

A simplified estimate is:

$$T_{continue} \approx \frac{\text{Remaining Footage}} {\text{Expected Current-Bit ROP}}$$

Option 2: Trip and replace the bit

Now the time to TD includes:

$$T_{replace} = T_{trip} + \frac{\text{Remaining Footage}} {\text{Expected New-Bit ROP}}$$

where $$T_{trip}$$ includes the relevant time required to:

  • trip out,
  • change or service the BHA,
  • run back in,
  • return to bottom,
  • and resume drilling.

The economic decision becomes:

Which path gets the well to TD sooner—or at lower expected cost?

This is much more useful than:

Is the bit damaged?

A damaged bit can still be the fastest path to TD.

Distance to TD Changes the Decision Dramatically

Consider a hypothetical example.

The current bit is drilling at:

70 ft/hr

A fresh replacement bit is expected to drill at:

150 ft/hr

Assume the total trip-and-return time is:

10 hours

Scenario A: 500 ft remaining

Continue:

$$500 / 70 = 7.1 \text{ hr}$$

Trip and replace:

$$10 + 500 / 150 = 13.3 \text{ hr}$$

Even though the current bit is substantially slower:

continuing is faster.

Scenario B: 3,000 ft remaining

Continue:

$$3000 / 70 = 42.9 \text{ hr}$$

Trip and replace:

$$10 + 3000 / 150 = 30 \text{ hr}$$

Now:

the trip is potentially worthwhile.

Nothing about the bit changed between the two scenarios.

Only the remaining footage changed.

That demonstrates why bit condition cannot determine the decision by itself.

Two-panel comparison showing how remaining footage changes whether continuing with the current PDC bit or tripping to replace it reaches TD faster

The same worn bit can produce opposite decisions depending on how much footage remains.

But Expected New-Bit ROP Is Not Known

The calculation above looks precise.

Reality is not.

How fast will the new bit drill?

We may have:

  • offset performance,
  • previous bit runs,
  • formation trends,
  • BHA history,
  • vendor expectations.

But the replacement-bit ROP is still a forecast.

Likewise, the exact TD may change.

The formation may change.

Trip time may be longer or shorter than expected.

The current bit may degrade faster than its recent ROP trend suggests.

That means a single deterministic calculation can create false confidence.

SPE/IADC-214608 addressed this by evaluating a range of possible replacement-bit ROP values and remaining distances to TD rather than requiring one exact forecast.[2]

The result can be represented as a decision surface or heat map.

That is an excellent way to handle uncertainty.

Instead of saying:

Pull.

the analysis can say:

If the fresh bit is expected to achieve at least this level of performance and more than this much footage remains, replacement becomes increasingly attractive.

That is much more informative.

Synthetic bit-pull decision heat map showing continue favored, decision sensitive, and replace favored regions across distance remaining to TD and expected replacement-bit ROP

Scenario maps make it clear which assumptions drive the bit-pull decision and whether the recommendation is robust.

The Break-Even Boundary Is More Useful Than a Yes/No Answer

A scenario map creates a useful concept:

the break-even boundary.

On one side:

the time saved by the faster bit is insufficient to recover the trip penalty.

On the other:

the improvement in drilling performance becomes large enough to justify the trip.

This allows the engineer to ask questions such as:

  • How much ROP improvement is required to justify a trip?
  • How does the decision change if trip time increases by four hours?
  • At what remaining footage does the decision reverse?
  • How sensitive is the answer to the assumed new-bit ROP?

This is a much better representation of uncertainty than one binary recommendation.

It shows whether the current decision is:

obvious

or

fragile.

If almost every reasonable scenario favors replacement, confidence should be high.

If a small change in assumed new-bit ROP flips the decision, the recommendation should be treated cautiously.

A Practical Break-Even Relationship

A simplified break-even condition can be derived by equating the two time paths:

$$\frac{D}{ROP_{old}} = T_{trip} + \frac{D}{ROP_{new}}$$

where:

  • $$D$$ = footage remaining,
  • $$ROP_{old}$$ = expected current-bit ROP,
  • $$ROP_{new}$$ = expected new-bit ROP,
  • $$T_{trip}$$ = total replacement trip time.

Solving for break-even footage:

$$D_{BE} = \frac{T_{trip}} { \left( \frac{1}{ROP_{old}} - \frac{1}{ROP_{new}} \right) }$$

This is a useful engineering expression because it makes the decision logic explicit.

For example:

  • longer trip time pushes break-even farther away,
  • poorer current-bit ROP pulls break-even closer,
  • larger expected new-bit improvement pulls break-even closer.

But again, every variable is an estimate.

The equation should inform the decision—not disguise uncertainty.

Trip Time Should Come From the Actual Operation

Using a generic trip-speed assumption can weaken the calculation.

Trip time depends on:

  • current depth,
  • hole geometry,
  • BHA,
  • casing/open-hole distribution,
  • connection practices,
  • reaming requirements,
  • pump-down procedures,
  • rig performance,
  • and known tight or problematic intervals.

Historical rig data can make this estimate much better.

Instead of assuming:

Trip time = 10 hours

an analytics system can estimate:

  • trip-out duration from similar previous trips,
  • BHA handling time,
  • run-in duration,
  • expected reaming/circulation time,
  • and return-to-bottom operations.

This is an excellent example of combining:

historical performance

with

real-time condition monitoring.

The real-time system tells us the current bit may be ineffective.

Historical data tells us what replacing it will probably cost in time.

Expected New-Bit Performance Should Also Be Conditional

The replacement-bit assumption deserves similar scrutiny.

Using the best ROP ever observed in the field is not a realistic forecast.

A more defensible estimate might be conditioned on:

  • formation,
  • hole size,
  • BHA configuration,
  • bit design,
  • depth interval,
  • offset runs,
  • mud system,
  • and current directional requirements.

Better still, use a distribution rather than a single number.

For example:

Expected fresh-bit ROP

  • P25 = 115 ft/hr
  • Median = 140 ft/hr
  • P75 = 165 ft/hr

Now the bit-pull decision can be tested over a realistic range.

If the trip only works economically under the P75 outcome, it is a weak recommendation.

If even the P25 outcome favors replacement, the decision is much stronger.

This moves the analysis from:

What do we think will happen?

to:

Across the range of outcomes we normally observe, how often does replacement appear advantageous?

That is a much more useful engineering question.
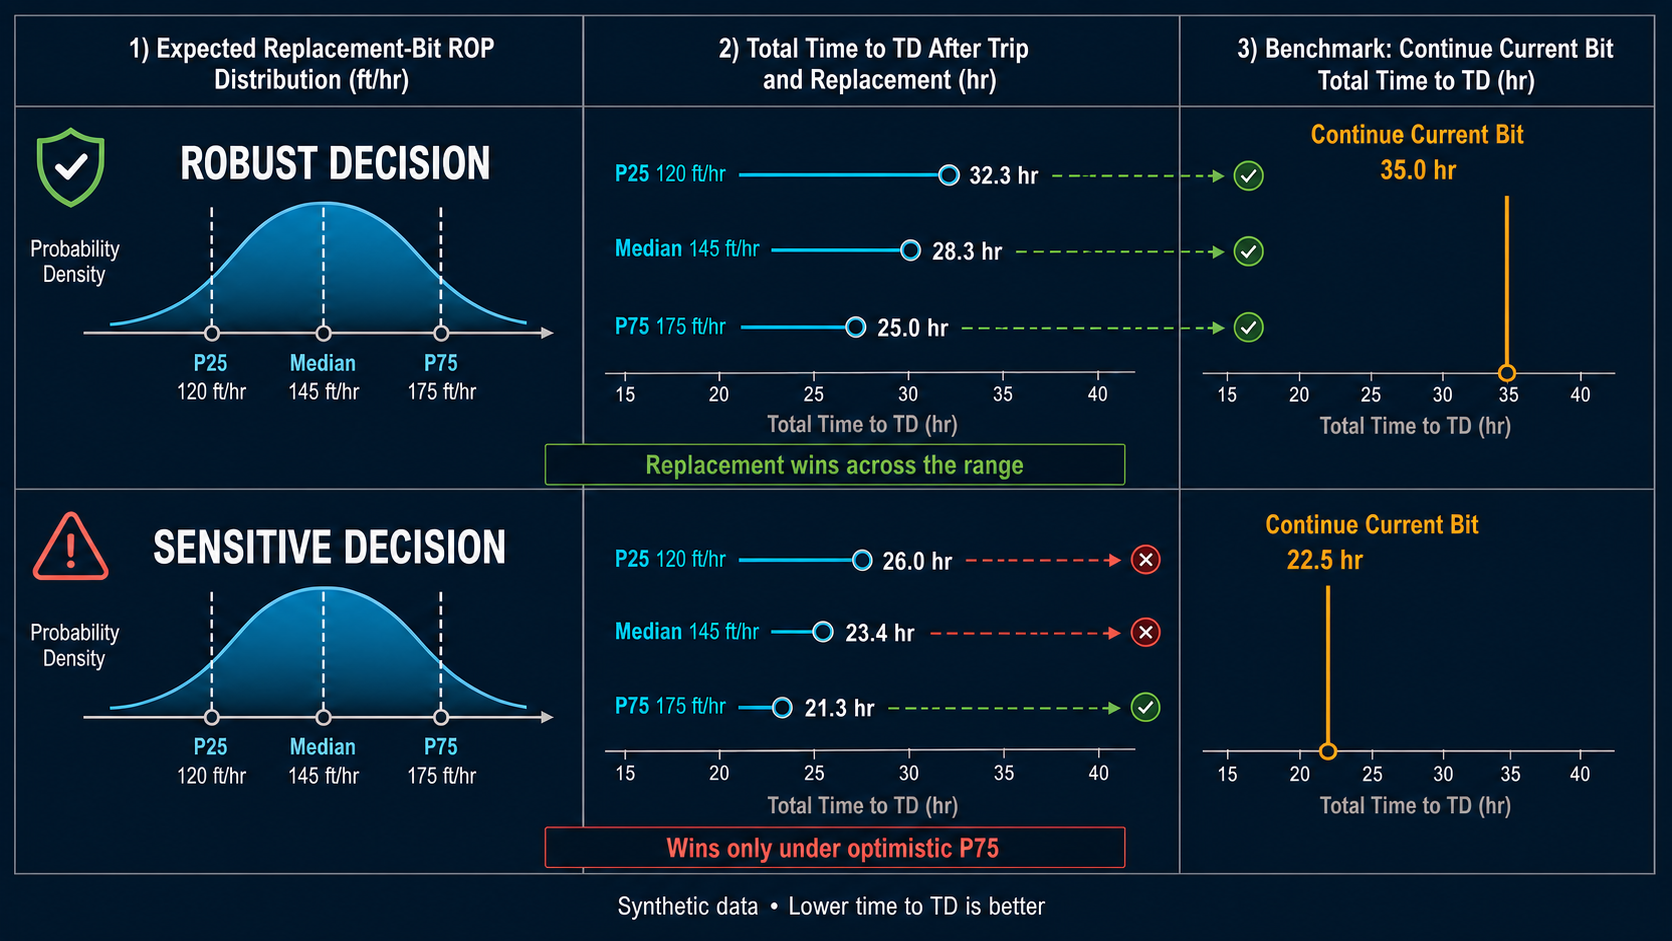
Expected replacement-bit ROP distribution and corresponding total-time-to-TD outcomes, comparing robust and sensitive bit-pull decisions

Using a realistic distribution of replacement-bit performance reveals whether a trip recommendation is robust or dependent on an optimistic forecast.

There Are Costs Beyond Time to TD

Time is usually the cleanest way to explain the problem, but operational decisions may include additional considerations.

Continuing with a degraded bit may increase:

  • risk of severe cutter damage,
  • ring-out,
  • loss of cutting structure,
  • damage that affects subsequent bit runs,
  • BHA vibration exposure,
  • or the probability of a more serious downhole failure.

SPE-205844 observed cases where damage accelerated rapidly after an apparent point of failure in the studied hard, abrasive formation.[1]

The authors also discussed the value of pulling before the bit became damaged beyond repair.

Therefore, the actual decision may need to compare:

$$\text{Expected Cost Continue}$$

with

$$\text{Expected Cost Replace}$$

rather than time alone.

That cost can incorporate:

  • rig spread time,
  • bit cost,
  • repairability,
  • risk of catastrophic failure,
  • expected subsequent ROP,
  • and operational consequences.

The more severe the downside of continuing, the less attractive a purely time-minimizing approach becomes.

The Best Recommendation Can Be "Keep Watching"

Not every decision needs to be:

continue

or

trip now.

Suppose:

  • bit-effectiveness evidence is deteriorating,
  • ROP has fallen,
  • but the decision surface is close to break-even,
  • and there is still uncertainty about whether stick-slip is contributing.

A reasonable recommendation could be:

Continue for one or two stands while changing parameters to mitigate dysfunction and re-evaluate.

That creates a third state:

monitor / test / reassess.

This is important because drilling decisions are sequential.

More evidence will arrive.

The next stand may show:

  • ROP recovery,
  • continued degradation,
  • increased torque instability,
  • or another formation change.

Real-time analytics should take advantage of that.

The objective is not to force the earliest possible decision.

It is to make the decision when the evidence and economics become sufficiently persuasive.

A Practical Bit-Pull Decision Workflow

A structured real-time workflow could look like this.

1. Detect performance degradation

Examine:

  • ROP trend,
  • depth of cut,
  • WOB,
  • RPM,
  • torque,
  • bit-degradation indicators.

2. Establish whether the change is persistent

Do not react to one poor minute or one slow stand without context.

Look for sustained departure from the expected baseline.

3. Check formation context

Ask whether the performance change corresponds to:

  • a harder interval,
  • a known formation transition,
  • or another geological explanation.

4. Investigate drilling dysfunctions

Check for evidence of:

  • stick-slip,
  • whirl,
  • bit balling,
  • poor hydraulics,
  • inefficient parameter selection.

Correct reversible causes where practical.

5. Re-evaluate bit effectiveness

Did ROP recover?

Did the degradation trend stabilize?

If not, bit damage becomes a stronger explanation.

6. Estimate time to TD with the current bit

Use a realistic current-bit ROP forecast, ideally accounting for recent degradation.

7. Estimate replacement-trip time

Use actual historical rig performance wherever available.

8. Estimate replacement-bit performance

Use comparable offset or historical runs rather than an optimistic single number.

9. Evaluate a range of scenarios

Vary:

  • distance to TD,
  • replacement-bit ROP,
  • trip time,
  • continued degradation rate.

10. Decide based on robustness

Ask:

Does replacement win across most reasonable scenarios?

If yes, the trip decision is stronger.

If the result flips easily with small assumption changes, continue monitoring or gather more evidence.

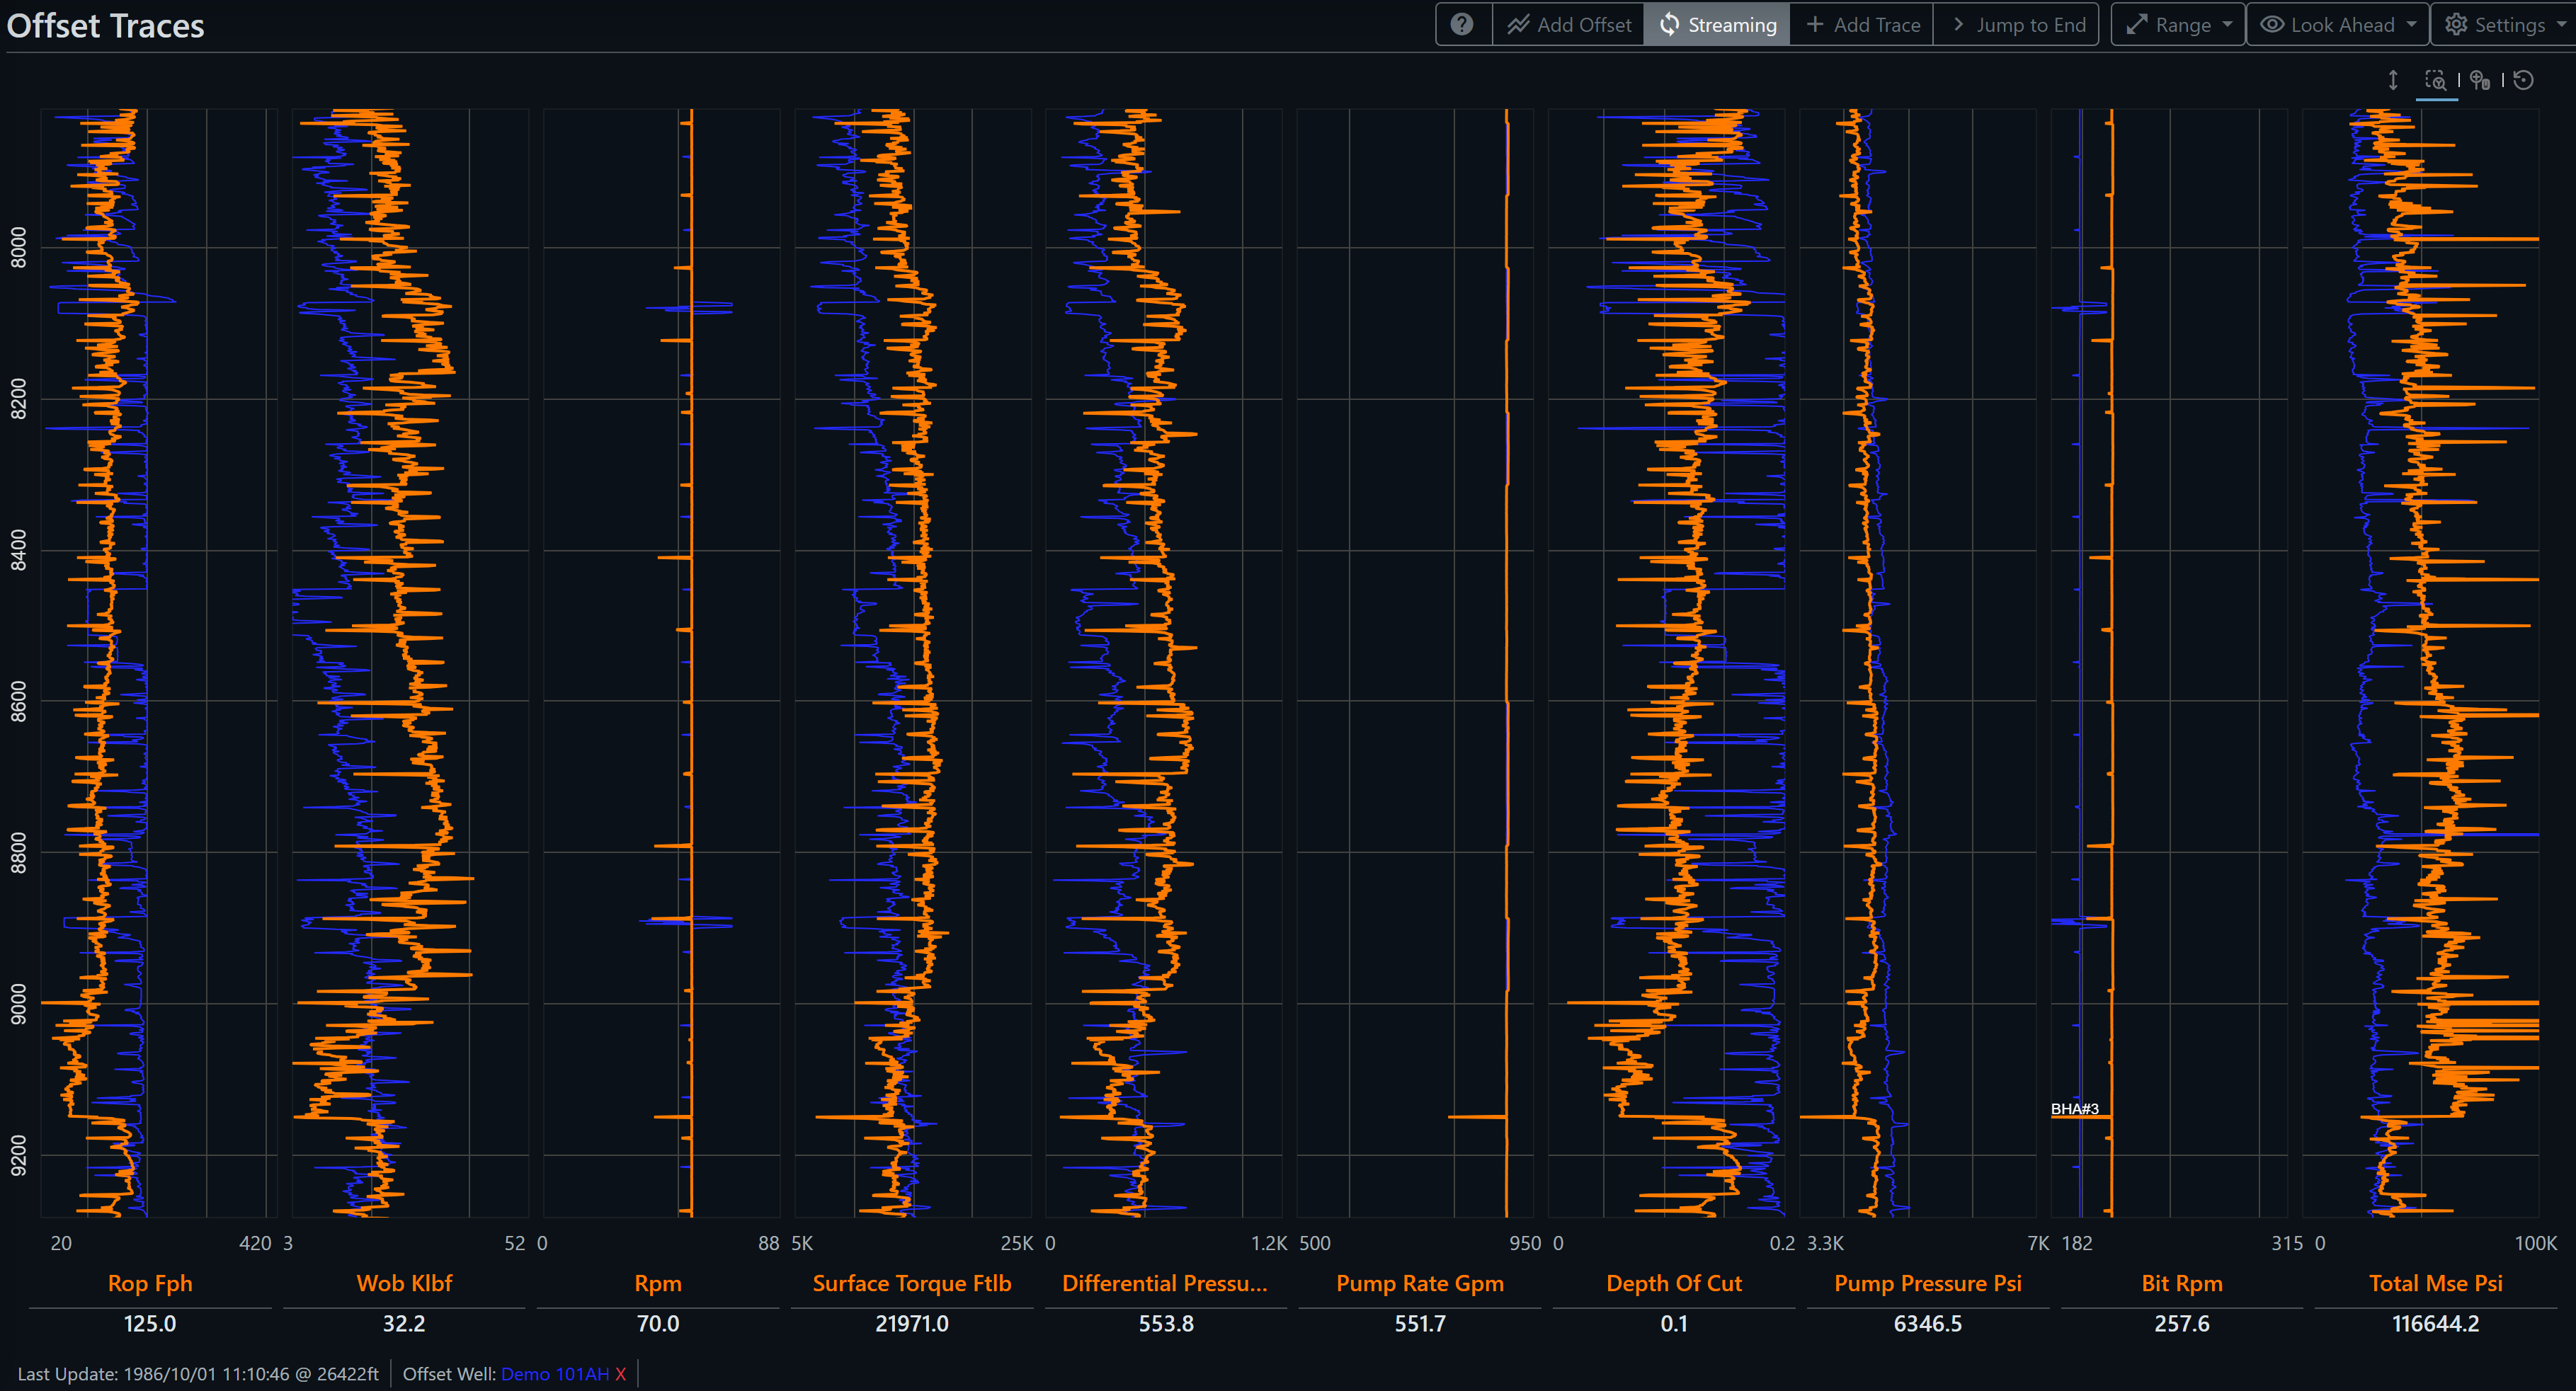
DrillingMetrics offset traces comparing ROP, WOB, RPM, torque, depth of cut, pump pressure, bit RPM, and total MSE across BHA runs

Across BHA run 2, depth of cut trends lower while total MSE rises relative to its earlier baseline and the offset well. After a new bit is picked up for BHA run 3, depth of cut returns toward trend and MSE establishes a lower baseline closer to the offset—behavior consistent with possible bit damage during the later part of run 2.

A Hypothetical Decision

Consider a bit currently drilling at 80 ft/hr.

Recent evidence suggests that performance is declining.

The expected replacement-bit ROP based on comparable runs is:

  • P25: 120 ft/hr
  • Median: 145 ft/hr
  • P75: 175 ft/hr

Historical operations suggest the total trip-and-return time will likely be:

9–12 hours.

Remaining footage is:

2,800 ft.

Instead of calculating one answer, evaluate the matrix.

Conservative case

  • new-bit ROP: 120 ft/hr
  • trip time: 12 hr

Base case

  • new-bit ROP: 145 ft/hr
  • trip time: 10 hr

Favorable case

  • new-bit ROP: 175 ft/hr
  • trip time: 9 hr

Now compare each to the expected time required to finish with the current bit.

If replacement wins only in the favorable scenario, the decision is fragile.

If it wins even in the conservative case, the evidence for pulling becomes much stronger.

This is the core value of scenario analysis.

It does not eliminate uncertainty.

It shows how much the uncertainty matters.

From Condition Monitoring to Decision Intelligence

A wear metric is useful.

A bit-effectiveness indicator is better.

But neither is the final objective.

The operational question is:

What should we do now?

Answering that requires combining different kinds of information:

Measurement

  • ROP
  • WOB
  • RPM
  • torque

Derived engineering quantities

  • DOC
  • modeled downhole torque
  • bit-degradation indicators

Statistical evidence

  • recent trends
  • historical baselines
  • replacement-bit performance distributions

Operational context

  • current depth
  • remaining footage
  • formation
  • BHA
  • dysfunction state

Economics

  • trip time
  • rig cost
  • bit replacement cost
  • risk of continued drilling

That combination is what turns surveillance into decision support.

The Decision Is Not "Is the Bit Worn?"

The simplest bit-pull workflow asks:

Is the bit worn?

A stronger workflow asks:

Is the bit currently ineffective?

A stronger one still asks:

Is the observed inefficiency actually caused by irreversible bit degradation?

But the question that ultimately matters is:

Given the current bit condition, remaining footage, trip cost, expected replacement performance, and uncertainty in each, which option has the better expected outcome?

That is why bit-pull decisions are a useful model for modern drilling intelligence.

The analytics should not merely identify a problem.

They should connect the engineering evidence to the operational consequence of acting—or not acting—on it.


References

  1. Witt-Doerring, Y., Pastusek, P. P., Ashok, P., and van Oort, E. Quantifying PDC Bit Wear in Real-Time and Establishing an Effective Bit Pull Criterion Using Surface Sensors. SPE-205844-MS, SPE Annual Technical Conference and Exhibition, 2021.

  2. Yi, M., Ashok, P., Ramos, D., Pearce, J., Hickin, G., Peroyea, T., White, S., Thetford, T., and Behounek, M. Field Deployment of a Real-Time Bit Pull Advisory System. SPE/IADC-214608-MS, SPE/IADC Middle East Drilling Technology Conference and Exhibition, Abu Dhabi, UAE, 2023.