Interpreting PDC Bit Wear from Surface Drilling Data
Surface measurements can reveal changes consistent with PDC degradation, but they do not measure cutter wear directly. The strongest surveillance combines mechanics-based indicators, baseline departure, operating context, and post-run validation.
A PDC cutter is degrading thousands of feet below the rig floor.
The drilling engineer does not see the wear flat growing.
The driller does not see a chipped cutter.
There may be no downhole vibration tool capable of continuously reporting cutter condition.
What the rig does have is:
- WOB,
- RPM,
- torque,
- ROP,
- flow,
- differential pressure,
- standpipe pressure.
Can those surface measurements tell us that the bit is wearing out?
To a degree, yes.
But the problem requires careful wording.
Surface drilling data can provide evidence consistent with changing bit effectiveness.
It does not directly measure cutter wear.
That distinction is fundamental.
A bit may become less effective because cutters are:
- gradually wearing,
- chipped,
- thermally damaged,
- structurally overloaded.
But similar surface behavior can also appear because:
- the formation became harder,
- stick-slip developed,
- the bit balled,
- the motor degraded,
- weight transfer changed,
- hole cleaning deteriorated.
The real analytical problem is therefore not:
Can we calculate bit wear from surface data?
It is:
Can we detect a change in drilling response that is consistent with bit degradation, and gather enough independent evidence to distinguish that change from other explanations?
SPE-205844 provides a particularly useful field study of this question.[1]
The authors analyzed 51 lateral production-hole bit runs across nine wells using ordinary surface EDR data together with post-run PDC dull photographs.
Their methodology illustrates both the promise and the limitation of real-time bit surveillance.
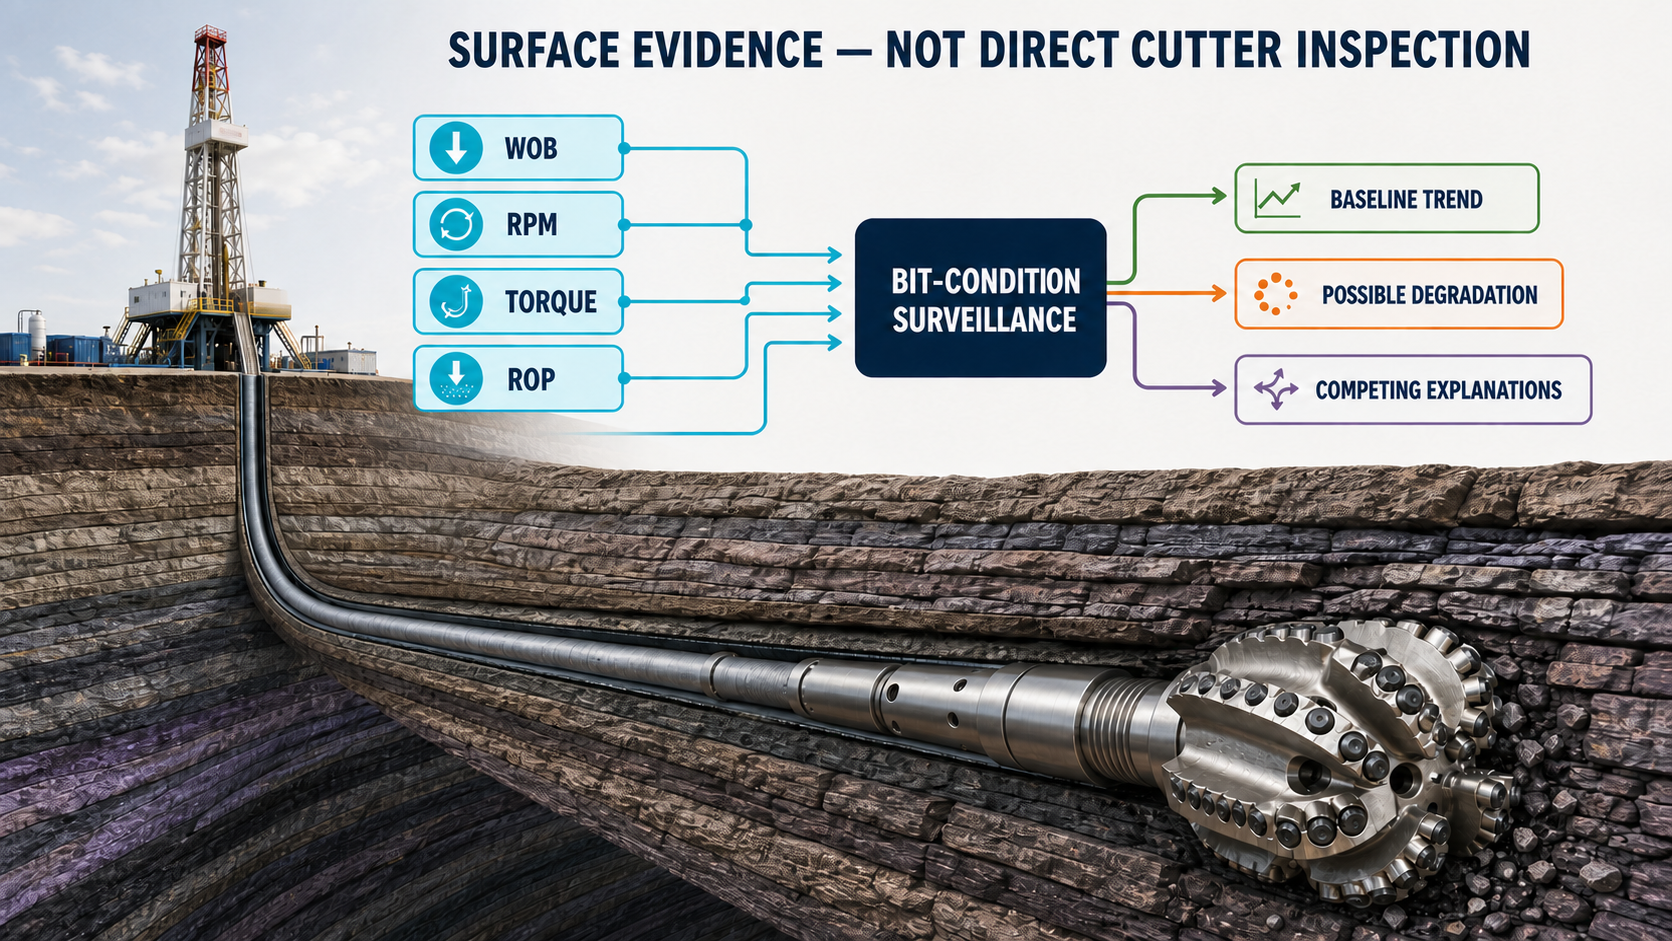
Bit degradation occurs downhole, while most real-time evidence is measured at surface. Surveillance connects those signals to a changing bit response without claiming direct cutter inspection.
Why ROP Alone Is Not Enough
The most obvious bit-performance signal is ROP.
Suppose a bit drills:
220 ft/hr
and several stands later:
150 ft/hr.
Has the bit worn out?
Possibly.
But ROP also depends on:
- WOB,
- RPM,
- formation,
- hydraulics,
- dysfunction,
- directional mode.
If WOB was reduced substantially, the ROP decline may be expected.
If the formation became harder, the bit may still be performing normally.
If stick-slip appeared, the bit may be mechanically inefficient without yet being significantly worn.
ROP therefore describes:
the result of the drilling process.
It does not isolate:
bit condition.
A useful wear indicator attempts to normalize some of the mechanical conditions producing that ROP.
Think in Terms of Work per Foot
One useful way to understand PDC wear is to consider how much loaded cutter travel occurs while drilling a unit distance.
Suppose the bit rotates rapidly but advances slowly.
The cutters travel around the bottom many times to drill each foot.
Now suppose the bit advances rapidly at the same RPM.
The cutters require fewer revolutions per foot.
That relationship is closely connected to depth of cut.
Conceptually:
$$DOC \propto \frac{ROP}{RPM_{bit}}$$
Higher DOC means more axial advance per revolution.
Lower DOC means more cutter revolutions are required to create the same footage.
SPE-205844 used this concept to build a wear indicator combining:
- bit rotational speed,
- ROP,
- WOB.
A simplified form used in the study was:
$$Wear\ Indicator = 60 \cdot \frac{RPM_{bit}}{ROP} \cdot WOB$$
and equivalently:
$$Wear\ Indicator = 60 \cdot \frac{WOB}{DOC}$$
under the unit convention used in that work.[1]
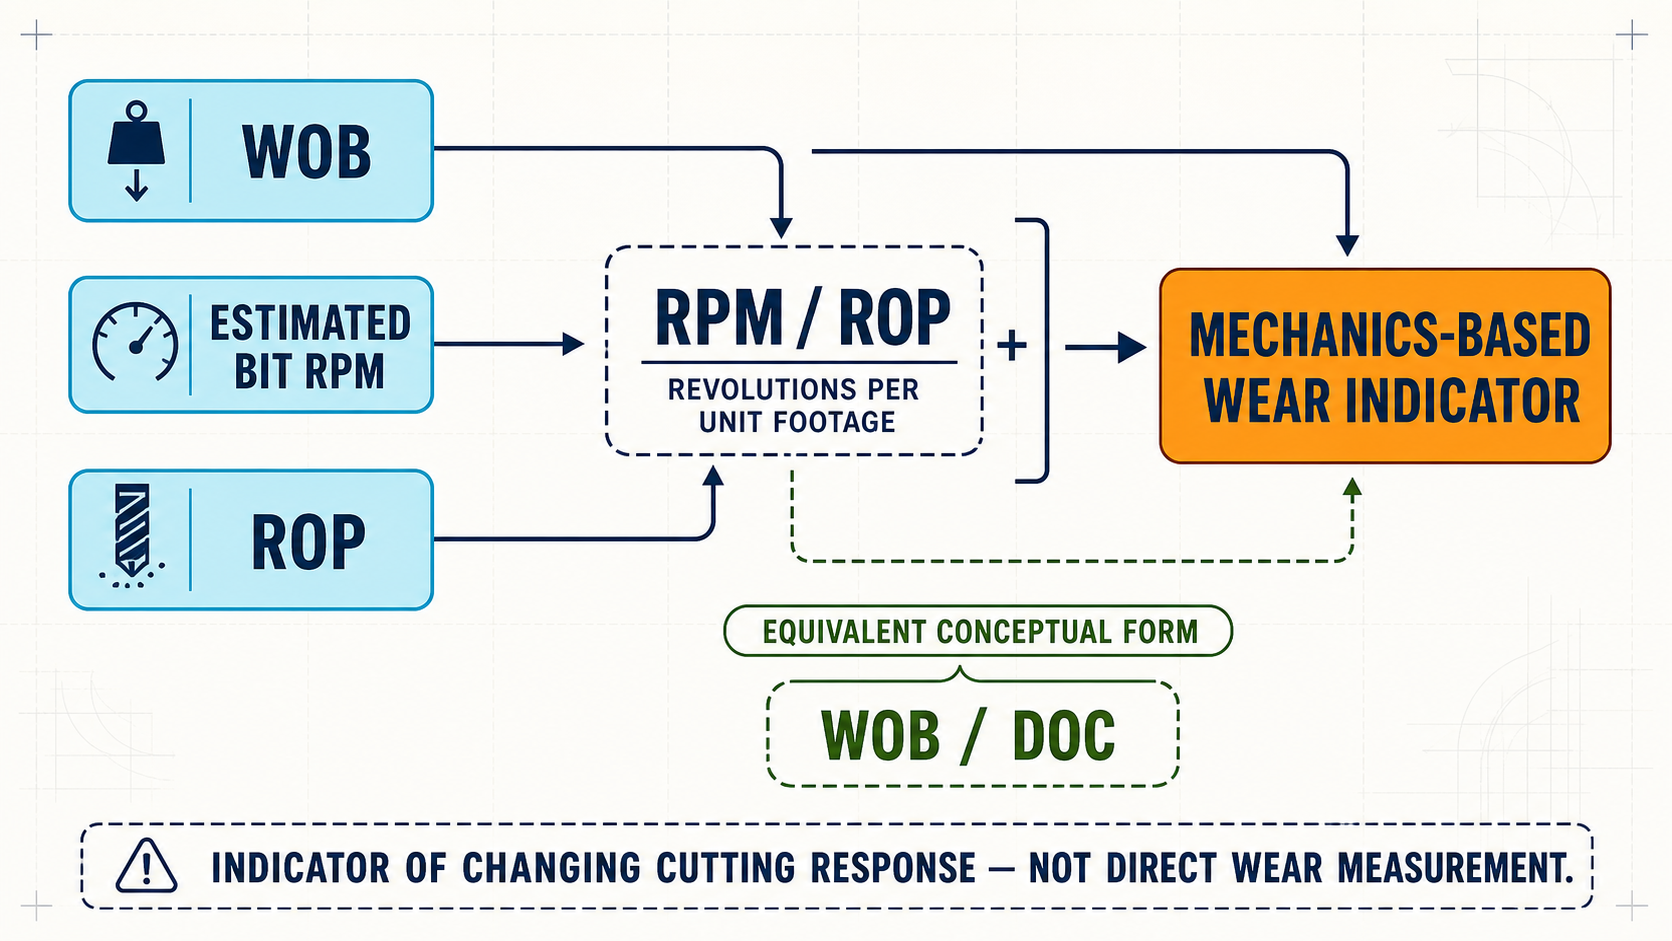
The mechanics-based indicator combines load with rotational travel per unit footage; it is an indicator of changing cutting response, not a direct wear measurement.
The physical intuition is more important than memorizing the equation:
More loaded cutter travel per foot drilled implies greater opportunity for abrasive wear and thermal loading.
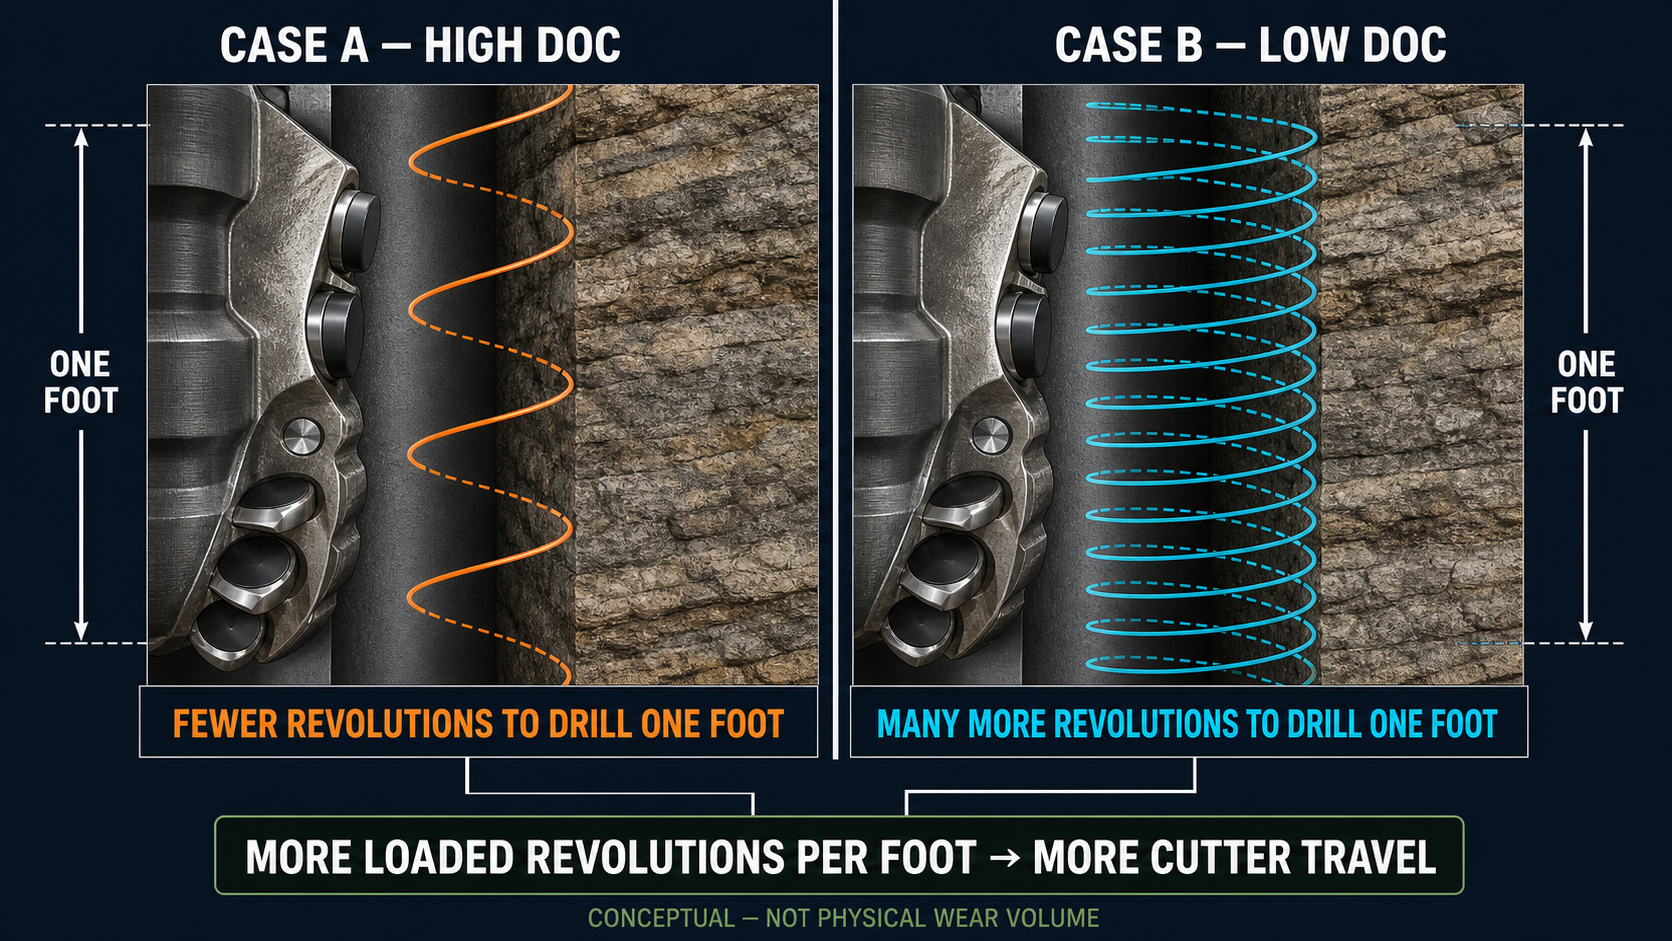
Lower depth of cut requires more loaded revolutions to drill the same footage, increasing conceptual cutter travel without directly measuring physical wear volume.
The Metric Is Not Physical Wear Volume
This qualification matters.
The wear indicator described in SPE-205844 was explicitly not presented as a quantitative measurement of actual volumetric cutter wear.[1]
It is an indicator.
That is a very different claim.
The cutters may physically experience:
- abrasion,
- thermal degradation,
- impact damage,
- structural overload.
Surface measurements see only the resulting drilling response.
A useful interpretation is therefore:
$$Indicator \rightarrow Evidence\ of\ Changing\ Cutting\ Response$$
not:
$$Indicator = Actual\ Cutter\ Wear$$
This protects the analysis from false precision.
The Baseline Is Often More Important Than the Absolute Value
Suppose the wear indicator is:
4,500
Is that high?
Without context, the number means little.
Now suppose the bit has followed a stable progression:
2,100
2,200
2,300
2,450
2,600
and suddenly becomes:
4,500.
That departure is much more informative.
SPE-205844 emphasizes the use of the metric as a means of tracking departure from a baseline.[1]
This is similar to several other drilling-surveillance problems.
The strongest question is often not:
Is the value high?
It is:
Has the relationship between mechanical input and drilling response changed unexpectedly?
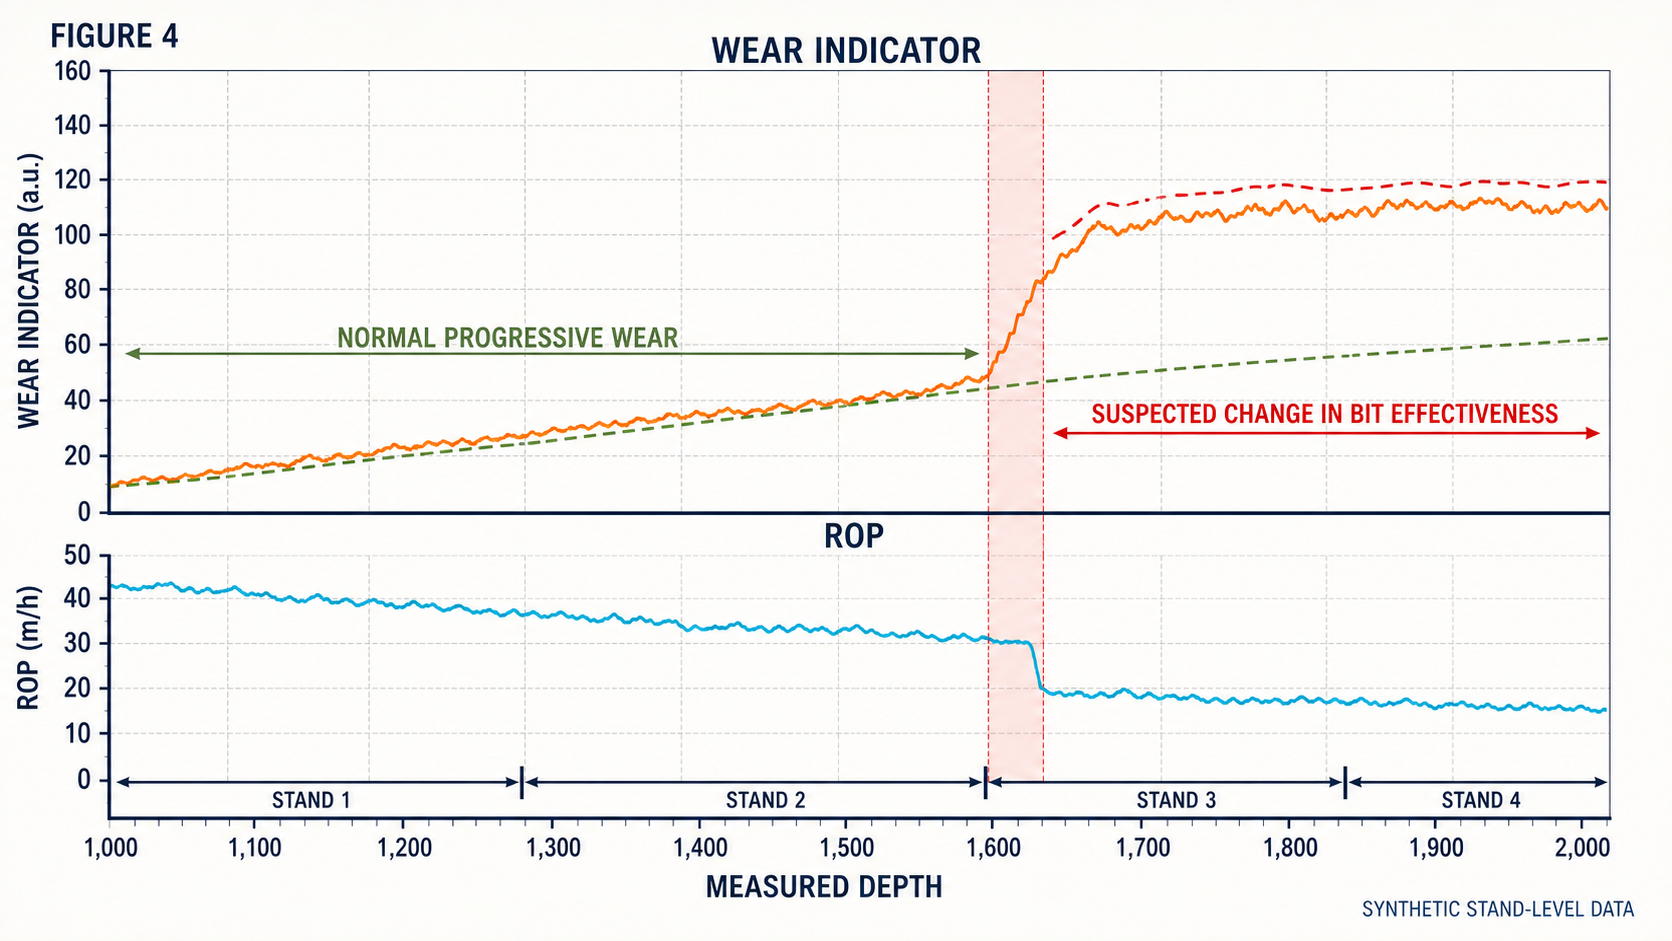
A persistent departure from the previous stand-level trend is more informative than an isolated high indicator value, but it still requires diagnosis.
Why Stand-Level Statistics Help
Raw drilling signals can vary significantly second by second.
WOB oscillates.
ROP fluctuates.
Torque changes.
Formation varies locally.
If the objective is long-term bit deterioration, those rapid changes can obscure the trend.
SPE-205844 therefore did not interpret every 1-Hz observation independently.
The researchers:
- filtered the dataset,
- identified stands,
- calculated stand-level drilling statistics,
- used the median wear indicator for each stand,
- plotted the result versus measured depth.[1]
The median reduced local noise and made longer-term changes easier to see.
This is an excellent example of choosing the analytical timescale to match the physical problem.
For bit wear:
second-by-second noise
may be less useful than:
stand-to-stand progression.
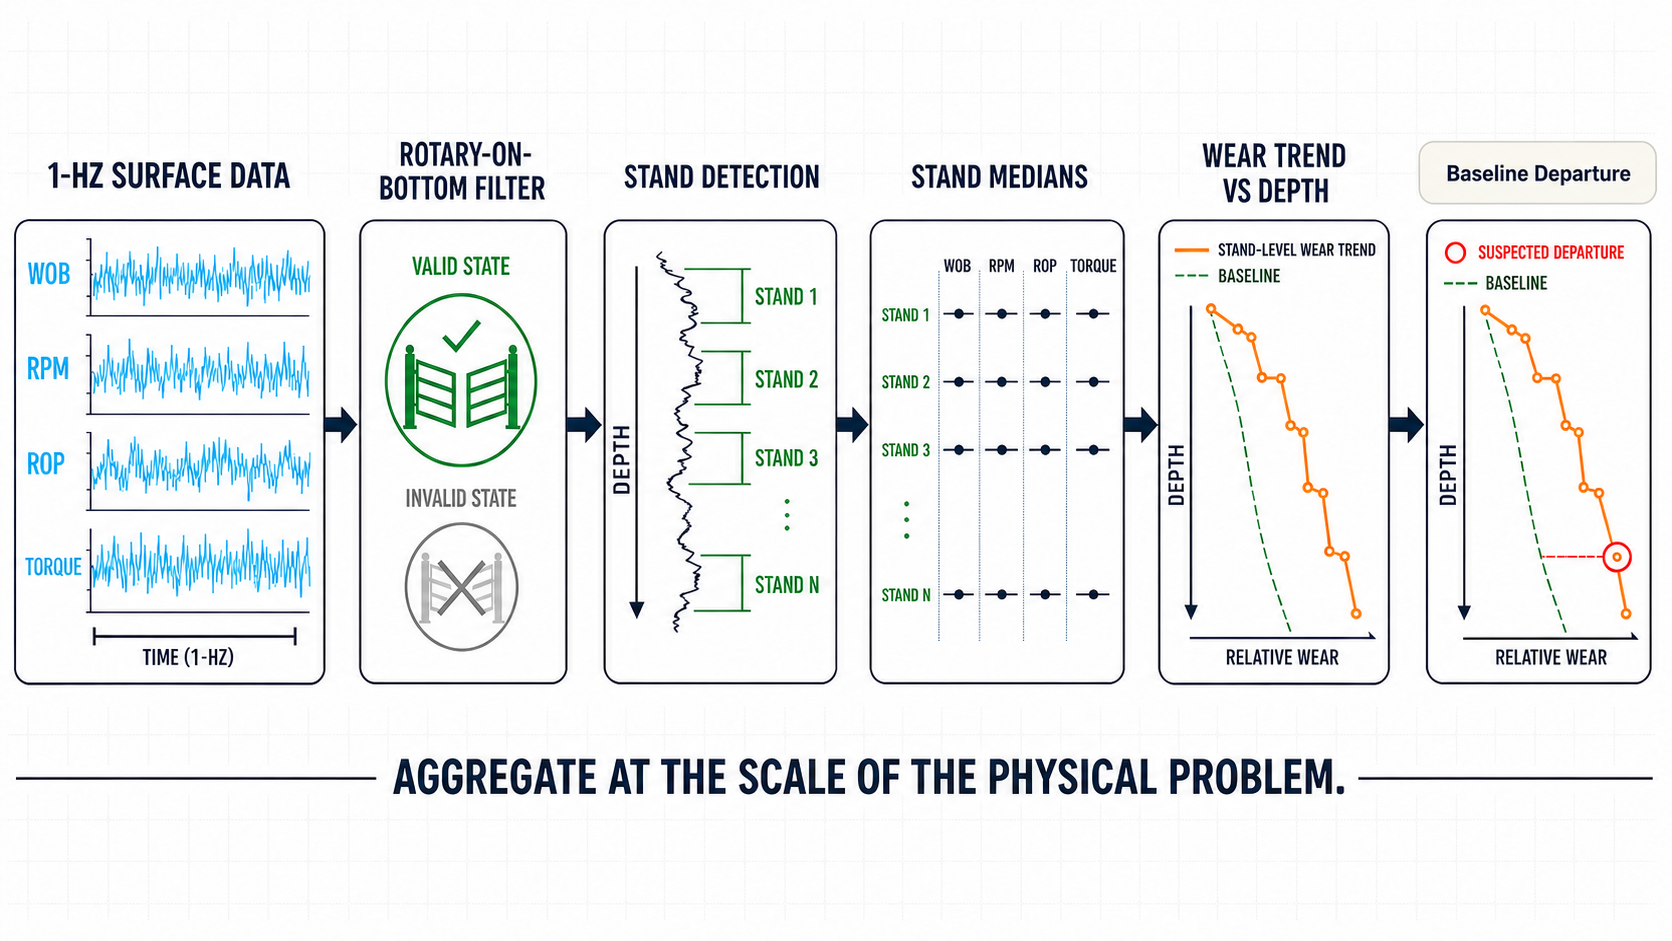
Filtering to the valid drilling state and aggregating by stand makes progressive bit-response trends easier to interpret than raw second-by-second noise.
Rotary Filtering Was Essential
The methodology also filtered the data to:
rotating on bottom.
Sliding was excluded.
Why?
Because the mechanical assumptions used by the indicator were more defensible during rotary drilling.
In particular, the authors note that high surface WOB during sliding was not treated as a reliable indication of formation hardness for the purpose of the study.[1]
This connects directly to the earlier slide-versus-rotate article.
A wear model should not blindly assume that:
$$Surface\ WOB_{rotary}$$
and:
$$Surface\ WOB_{slide}$$
have identical physical meaning.
Likewise, bit RPM during sliding may be dominated by the mud motor while surface RPM is zero.
State filtering is therefore not just data cleaning.
It establishes the physical population to which the model assumptions apply.
Bit RPM Is More Than Surface RPM When a Motor Is Running
In motor-assisted drilling, the study estimated bit rotational speed as:
$$RPM_{bit} \approx RPM_{surface} + RPM_{motor}$$
with motor RPM estimated from:
$$RPM_{motor} = Flow \times Motor\ Speed$$
using the motor's revolutions-per-gallon specification.[1]
This matters significantly.
Suppose:
Surface RPM:
120 rpm
Motor contribution:
100 rpm
Then the estimated bit RPM is approximately:
$$220\ rpm$$
Using only 120 rpm would materially underestimate the cutter travel.
During a slide:
surface RPM may be zero while bit RPM remains substantial.
This is another reason bit-wear analytics must preserve measurement provenance.
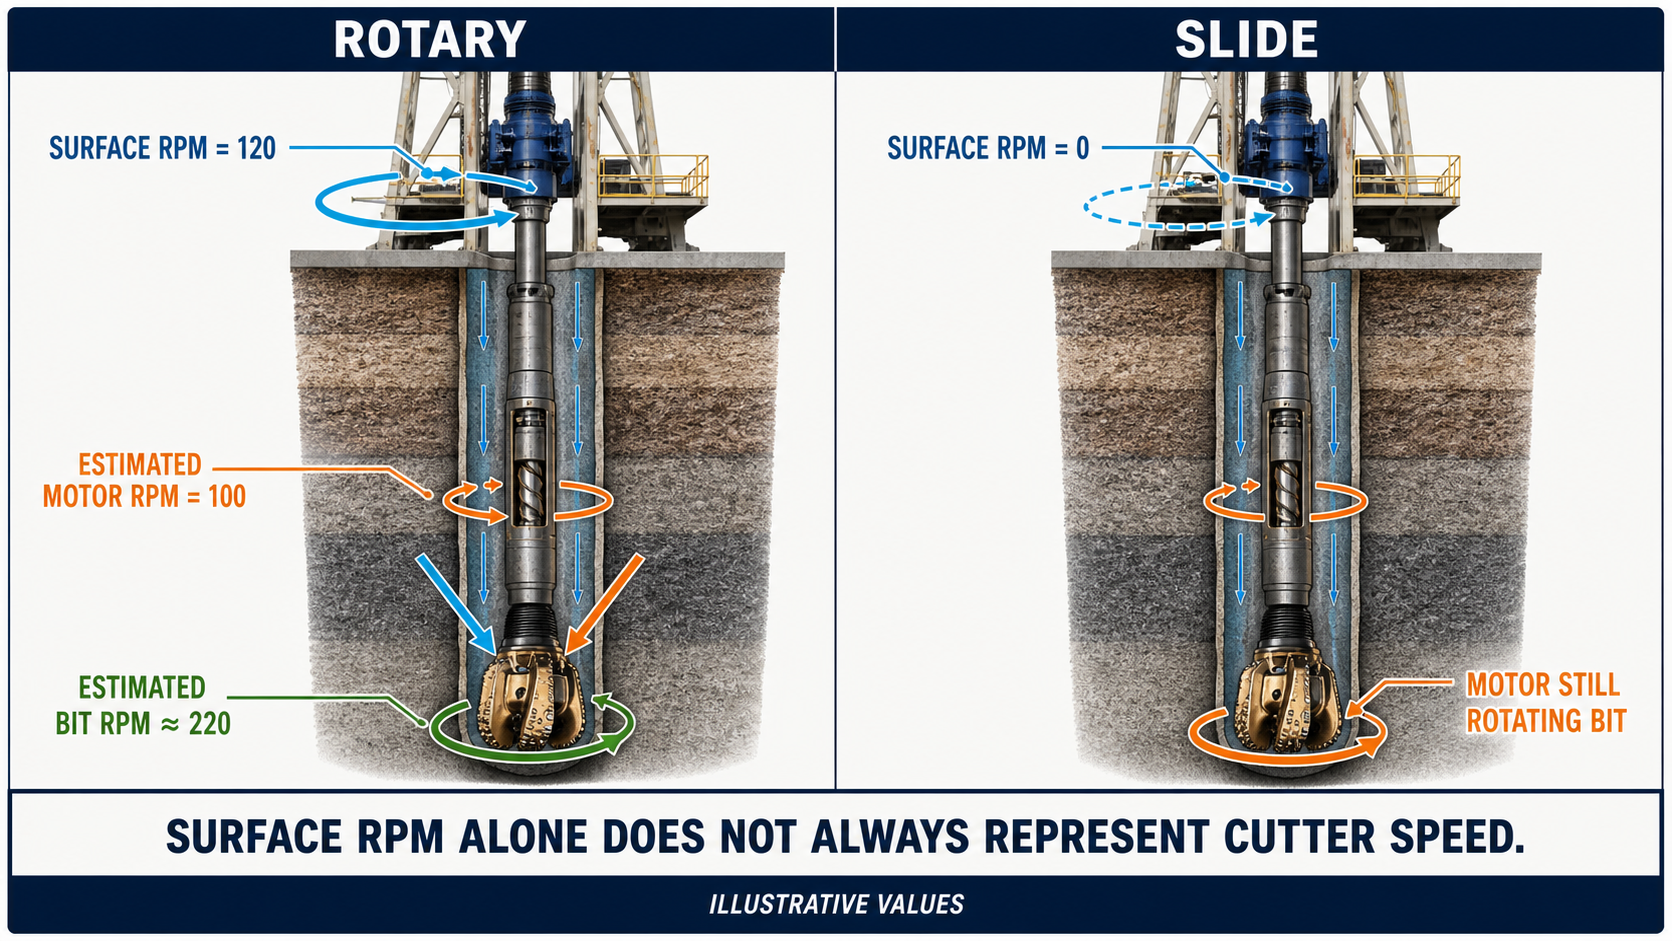
Surface RPM is only one contribution to cutter speed when a mud motor is present; motor RPM and bit RPM remain estimates.
But Motor RPM Is Still an Estimate
The calculation:
$$Flow \times rev/gal$$
does not magically create a direct bit-speed measurement.
Actual motor behavior can depend on:
- load,
- differential pressure,
- motor condition,
- fluid properties,
- wear.
Therefore:
estimated bit RPM
should remain labeled as an estimate.
This distinction becomes important when a bit-wear metric is very sensitive to rotational speed.
An uncertain input creates an uncertain derived indicator.
WOB Is Also an Assumption
The SPE-205844 rotary analysis broadly assumed that the magnitude of surface WOB was also experienced at the bit.[1]
That can be a workable assumption under the conditions of a particular study.
It is not universally true.
In extended laterals:
- friction,
- drag,
- drillstring contact
can influence axial load transfer.
Later real-time bit-degradation work incorporated modeled downhole torque context partly because surface torque in a horizontal section may not equal torque applied at the bit.[2]
The lesson is broader than one particular model:
A surface-derived bit metric inherits the assumptions of every surface measurement it uses.
Formation Change Can Look Like Wear
Suppose:
- WOB remains constant,
- RPM remains constant,
- ROP falls.
The wear indicator increases.
One interpretation is:
bit deterioration.
Another is:
harder rock.
SPE-205844 explicitly warns that formation changes can alter the ROP-dependent indicator even in the absence of bit wear or damage.[1]
That means a bit-surveillance system benefits greatly from:
- formation context,
- gamma/lithology,
- offset performance,
- rock-strength information where available.
A baseline established in one formation should not automatically be applied to another.
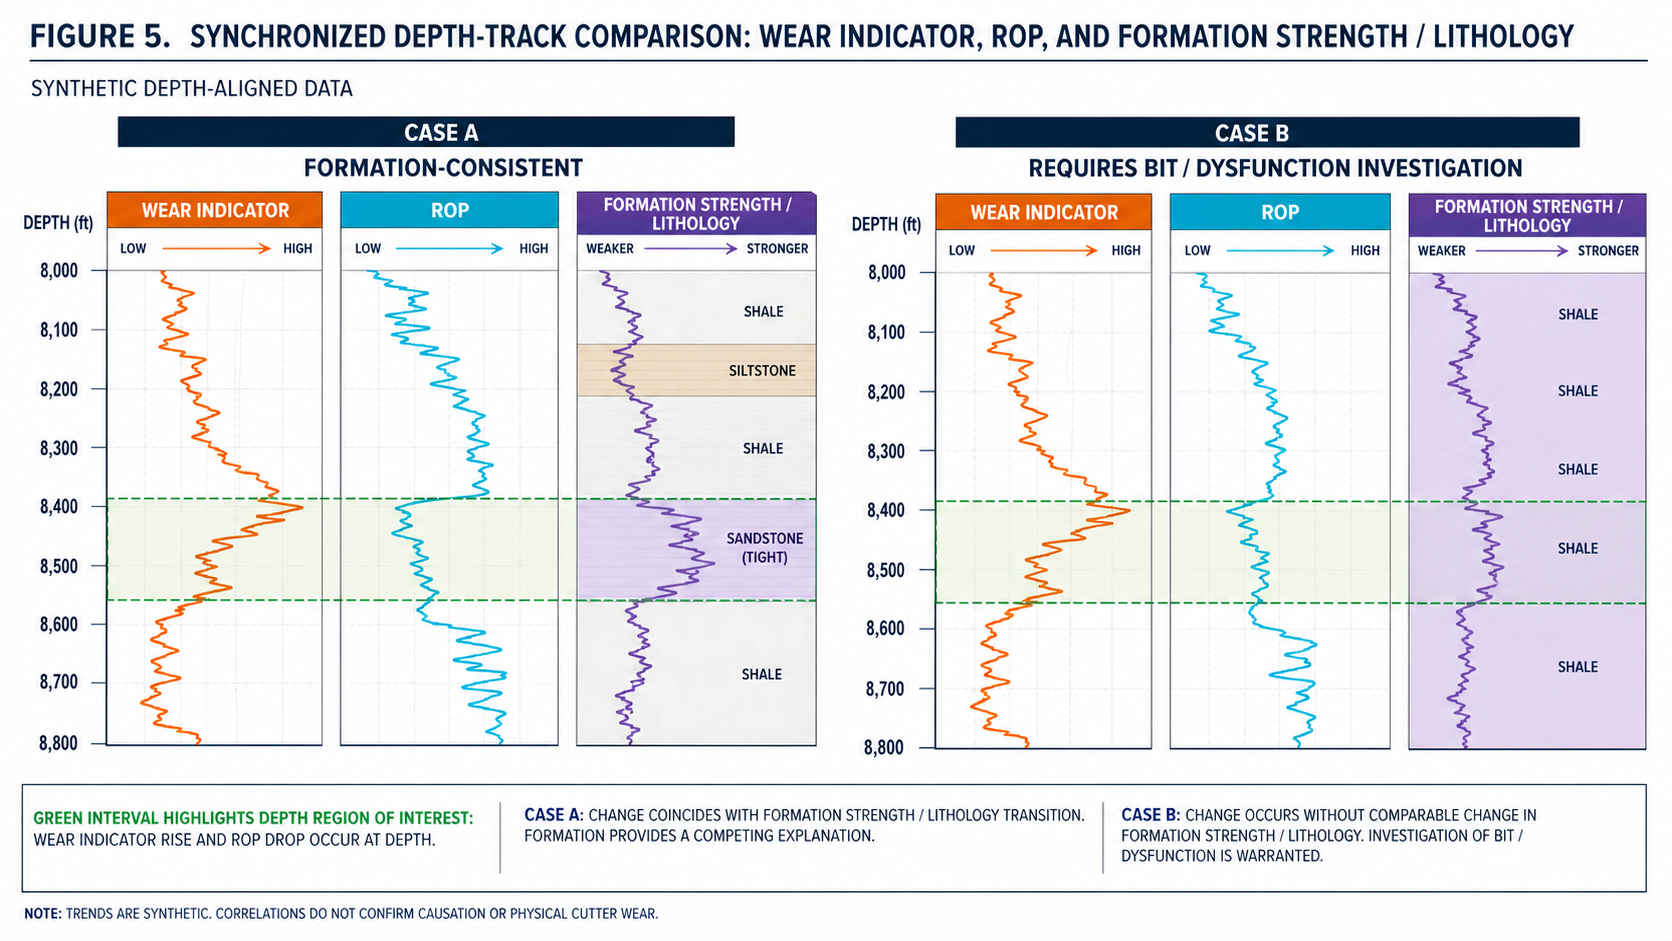
An indicator change that coincides with formation is different evidence from a departure within similar rock, although neither pattern proves cutter wear by itself.
Dysfunction Can Also Look Like Wear
Consider stick-slip.
ROP can decrease.
Effective bit speed becomes highly irregular.
Surface torque may oscillate.
A wear indicator can increase.
But the immediate problem may be:
drilling dysfunction
rather than:
progressive cutter wear.
The two can also interact.
A hard stringer may initiate dysfunction.
The dysfunction may damage cutters.
The damaged cutters may then reduce ROP permanently.
SPE-205844 explicitly notes that these events are not mutually exclusive.[1]
This makes root-cause analysis a sequence problem.
The engineer needs to ask:
What changed first?
Wear and Failure Are Not the Same Thing
A bit can experience gradual abrasive wear for thousands of feet.
That may be expected.
Failure is different.
Failure implies a more consequential change in cutting structure or effectiveness.
In the dataset studied in SPE-205844, the likely onset of failure was often associated with a distinct departure from the previous wear trend followed by ROP that did not recover.[1]
Once severe damage began in that particular hard, abrasive formation, subsequent catastrophic deterioration sometimes progressed rapidly.
Those observations were dataset-specific and should not be turned into universal footage rules.
The important concept is:
normal wear progression and failure onset can have different trend signatures.
Gradual Wear Should Look Different From a Sudden Departure
Conceptually:
Normal abrasive progression
Wear indicator:
gradually increasing with depth.
ROP:
gradually responding.
Sudden damage event
Wear indicator:
sharp change from prior baseline.
ROP:
step deterioration or failure to recover.
Formation transition
Indicator:
changes with geological context.
Dysfunction
Indicator:
changes with simultaneous mechanical instability.
These patterns may overlap.
But separating them conceptually improves interpretation.
Torque Can Add Information That ROP/WOB/RPM Miss
Later bit-degradation work identified cases where the earlier wear factor did not adequately describe damage.
One reason was that a degraded bit may also become less capable of transmitting useful cutting torque.
The later field-deployed system therefore incorporated additional mechanics information, including torque-transfer context, rather than relying on the original wear indicator alone.[2]
This is an important evolution.
A bit-condition model becomes stronger when it combines several pieces of evidence about cutting effectiveness rather than depending on a single scalar metric.
A Composite Metric Still Needs Diagnosis
Suppose a more advanced bit-degradation metric increases.
That still does not prove:
- thermal damage,
- chipped cutters,
- ring-out,
- impact damage.
A composite metric can improve detection.
It does not automatically create a unique forensic diagnosis.
The general surveillance sequence remains:
$$Metric\ Change \rightarrow Investigate\ Surface\ Evidence \rightarrow Compare\ Context \rightarrow Validate\ Against\ Bit\ Condition$$
Post-Run Dull Photos Are More Than Documentation
One of the strongest aspects of SPE-205844 is that the surface-data interpretation was compared with actual PDC dull photographs.[1]
That matters because field analytics needs a truth source.
Without post-run validation, it is easy to tell convincing stories from historical traces.
For example:
ROP fell here, so this must have been when the bit failed.
A dull photograph may reveal:
- severe ring-out,
- shoulder damage,
- thermal wear,
- surprisingly light wear.
The physical evidence can:
- support,
- modify,
- reject
the hypothesis derived from the surface data.
This is the scientific feedback loop.
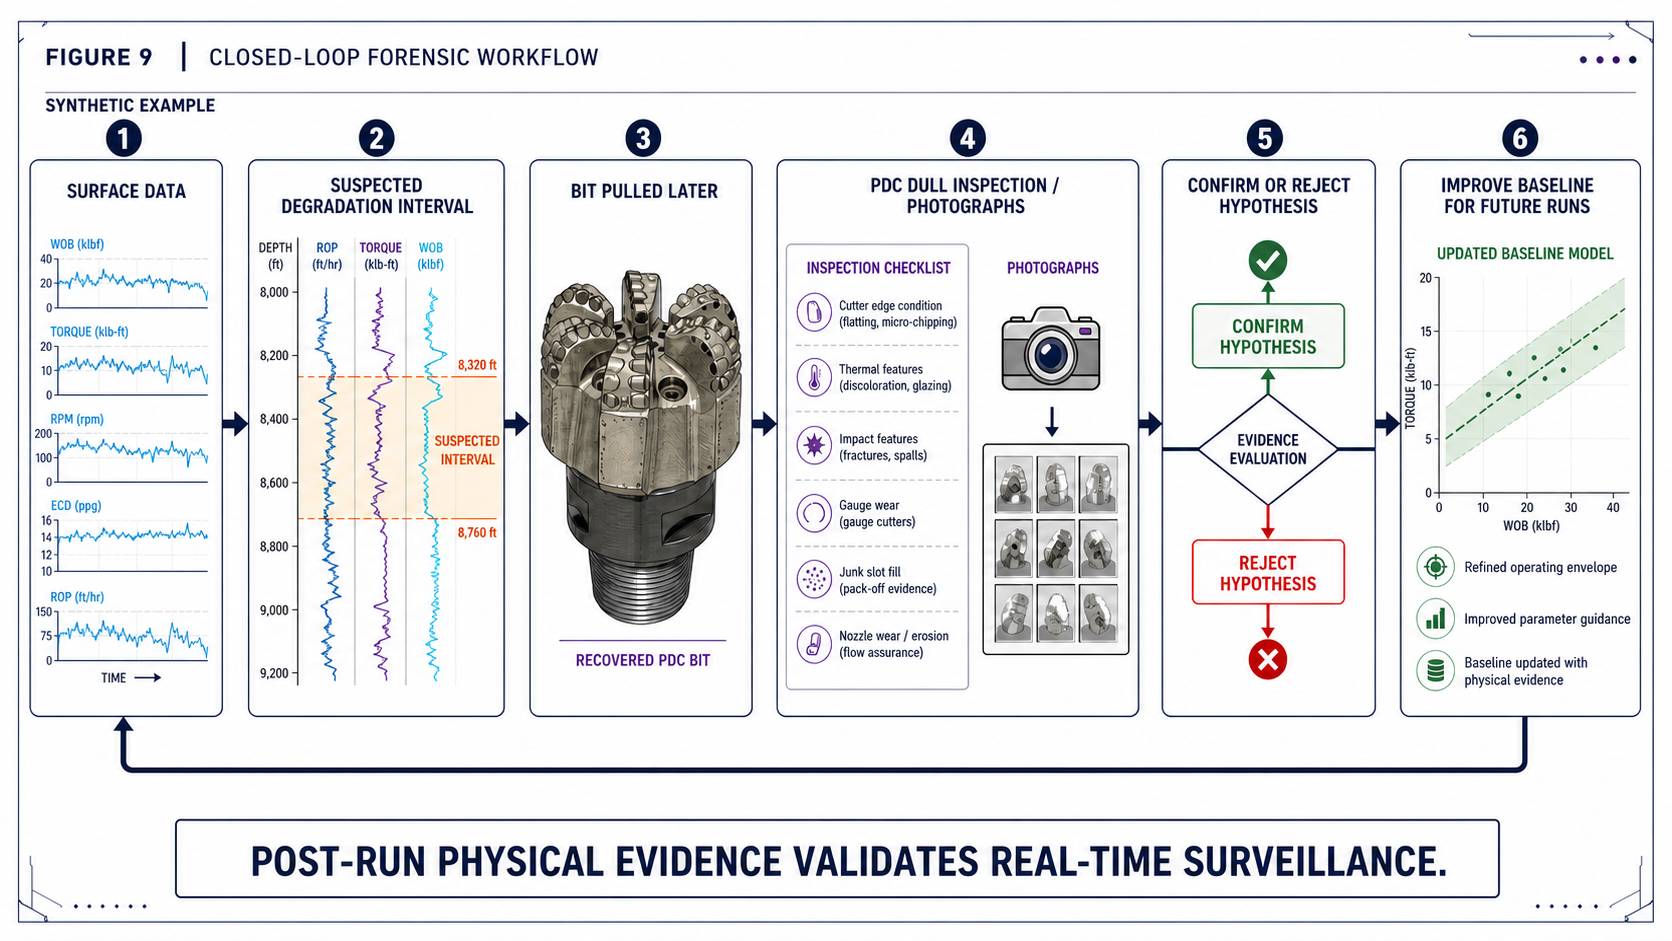
Post-run dull inspection can confirm, modify, or reject a surface-data hypothesis and improve the baseline used on future runs.
The Surface Signature May Not Reveal the Damage Mechanism
The paper also makes an important limitation explicit:
not all drilling dysfunctions or damaging events are easily inferred from surface data.[1]
A bit may experience damaging downhole motion without a clean, obvious surface signature.
That is especially relevant for phenomena such as:
- whirl,
- lateral vibration,
- transient cutter overload.
Surface measurements are filtered through the entire drillstring.
Some downhole dynamics attenuate or transform before reaching the rig floor.
Therefore:
absence of a clear surface dysfunction signal does not prove that damaging downhole dynamics were absent.
Downhole Sensors Remain Valuable
The study recommended further validation with high-frequency downhole data precisely because some failure mechanisms cannot be identified reliably from surface channels alone.[1]
That does not invalidate surface surveillance.
It defines its appropriate role.
Surface data is:
- inexpensive,
- broadly available,
- continuous.
Downhole data can provide:
- direct mechanical evidence,
- better vibration context,
- improved validation.
The two approaches are complementary.
Orientation and Stress State Can Affect the Relationship
One of the most interesting limitations in SPE-205844 appeared in a well drilled in a different orientation from the other wells.[1]
Several bit runs returned wear-indicator values suggesting relatively light wear even though the recovered bits showed substantial damage.
The authors proposed that differences involving:
- drilling dynamics,
- breakout,
- stress/strength anisotropy
could potentially affect the relationship.
The key lesson is not that one orientation causes the metric to fail.
It is:
A correlation calibrated in one population may not transport unchanged into a different physical context.
This is exactly why drilling analytics requires external validation.
A Baseline Should Be Formation- and Context-Specific
A useful bit-wear baseline may need to consider:
- formation,
- hole size,
- bit family,
- motor configuration,
- drilling mode,
- perhaps orientation.
If a dataset combines materially different conditions, the normal progression can become too broad to be useful.
This mirrors the earlier percentile and benchmarking articles.
The statistical model can only be as meaningful as the population it summarizes.
There Is a Difference Between Wear Surveillance and Bit-Pull Economics
This distinction deserves emphasis.
Suppose the evidence strongly suggests that the bit is degrading.
Does that mean pull immediately?
Not necessarily.
The bit-pull decision also depends on:
- distance to TD,
- expected future ROP,
- trip time,
- performance expected from a replacement bit,
- operational risk.
That was the subject of the earlier bit-pull article.
This article stops one step earlier.
Its question is:
What evidence tells us the bit may no longer be drilling as effectively as before?
The economic decision comes after.
Before Blaming the Bit, Check Reversible Problems
Later field-deployed bit advisory work incorporated an important operational safeguard.
When the analysis suggested a bit pull might be warranted, the crew was first directed to check for drilling dysfunctions such as:
- stick-slip,
- bit balling,
- whirl
and attempt to correct reversible conditions before concluding the bit itself had to be replaced.[2]
That principle is broadly useful.
A poor drilling response may be caused by:
irreversible bit damage
or:
a reversible operating condition.
The cost difference is enormous.
A Practical Example
Consider a hypothetical lateral.
For the previous 20 stands:
- formation approximately consistent,
- WOB ≈ 35 klbf,
- estimated bit RPM ≈ 210,
- rotary ROP gradually decreases from 210 to 190 ft/hr.
The stand-level wear indicator increases gradually.
That may be consistent with normal abrasive progression.
Stand 21
ROP:
188 ft/hr
No major change.
Stand 22
ROP:
184 ft/hr
Trend continues.
Stand 23
ROP suddenly falls to:
135 ft/hr
WOB and RPM are similar.
The wear indicator jumps sharply above the established trend.
Now investigate the raw drilling data.
Scenario A
Torque becomes highly oscillatory.
The next stand recovers to:
185 ft/hr
after parameters are changed.
Interpretation:
The indicator departure was likely driven substantially by a reversible dysfunction.
Scenario B
Torque behavior remains relatively normal.
ROP stays near:
130–140 ft/hr
for the following stands despite reasonable parameter changes.
Interpretation:
Evidence of a sustained change in bit cutting effectiveness is stronger.
Scenario C
A formation marker changes at exactly the same depth.
Offsets show similar ROP deterioration.
Interpretation:
Formation change remains a strong competing explanation.
The wear metric identified:
something changed.
Engineering context determines what that change most likely represents.
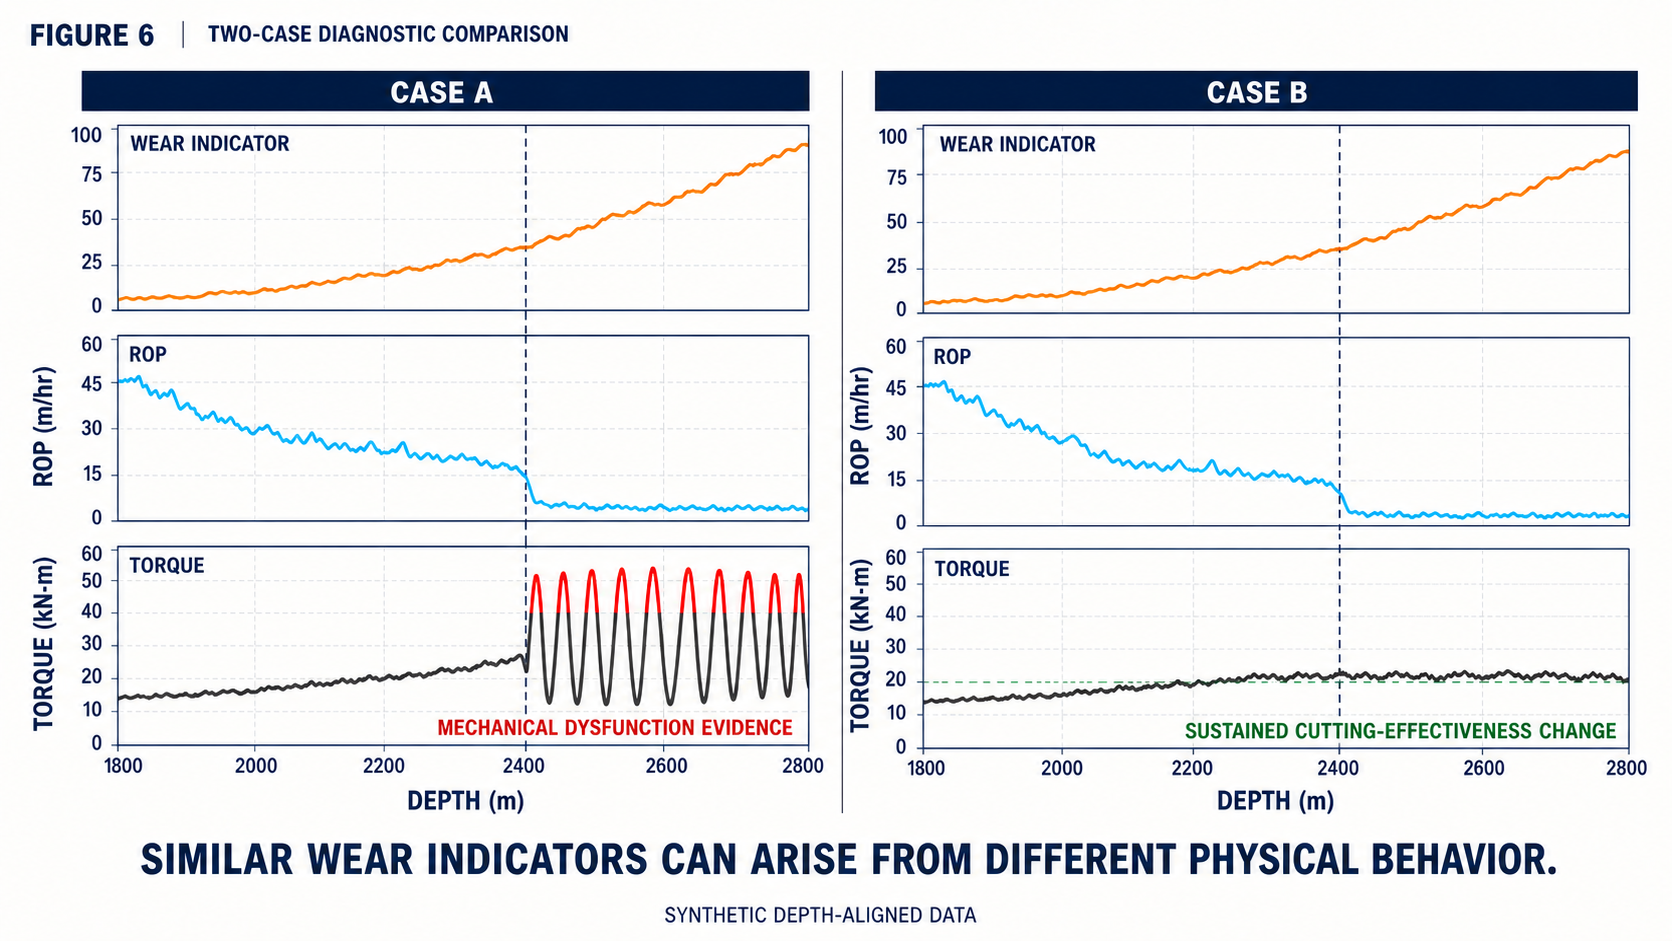
Similar increases in a wear indicator and decreases in ROP can arise from different physical behavior; torque stability helps direct the investigation.
A Practical Surface-Based Bit Surveillance Workflow
A defensible workflow might look like this.
1. Define the valid drilling state
For the selected model, identify:
- rotary,
- slide,
- other.
Do not mix states blindly.
2. Calculate bit rotational context
Distinguish:
- surface RPM,
- estimated motor RPM,
- estimated bit RPM.
3. Calculate the mechanics-based indicator
Use a documented and unit-consistent methodology.
4. Aggregate at a useful scale
For progressive wear:
- stand-level median,
- or another robust depth interval
may be more informative than instantaneous values.
5. Establish a baseline
Use comparable:
- formation,
- bit/BHA context,
- operating state.
6. Detect departures
Look for:
- gradual progression,
- step changes,
- failure to recover.
7. Review independent drilling evidence
Examples:
- raw torque,
- WOB,
- RPM,
- differential pressure,
- MSE,
- formation data.
8. Check reversible dysfunction
Do not immediately attribute poorer cutting response to permanent bit damage.
9. Preserve uncertainty
If formation and bit degradation remain plausible:
say so.
10. Validate after the run
Compare the inferred history with:
- dull grade,
- photographs,
- observed cutter damage.
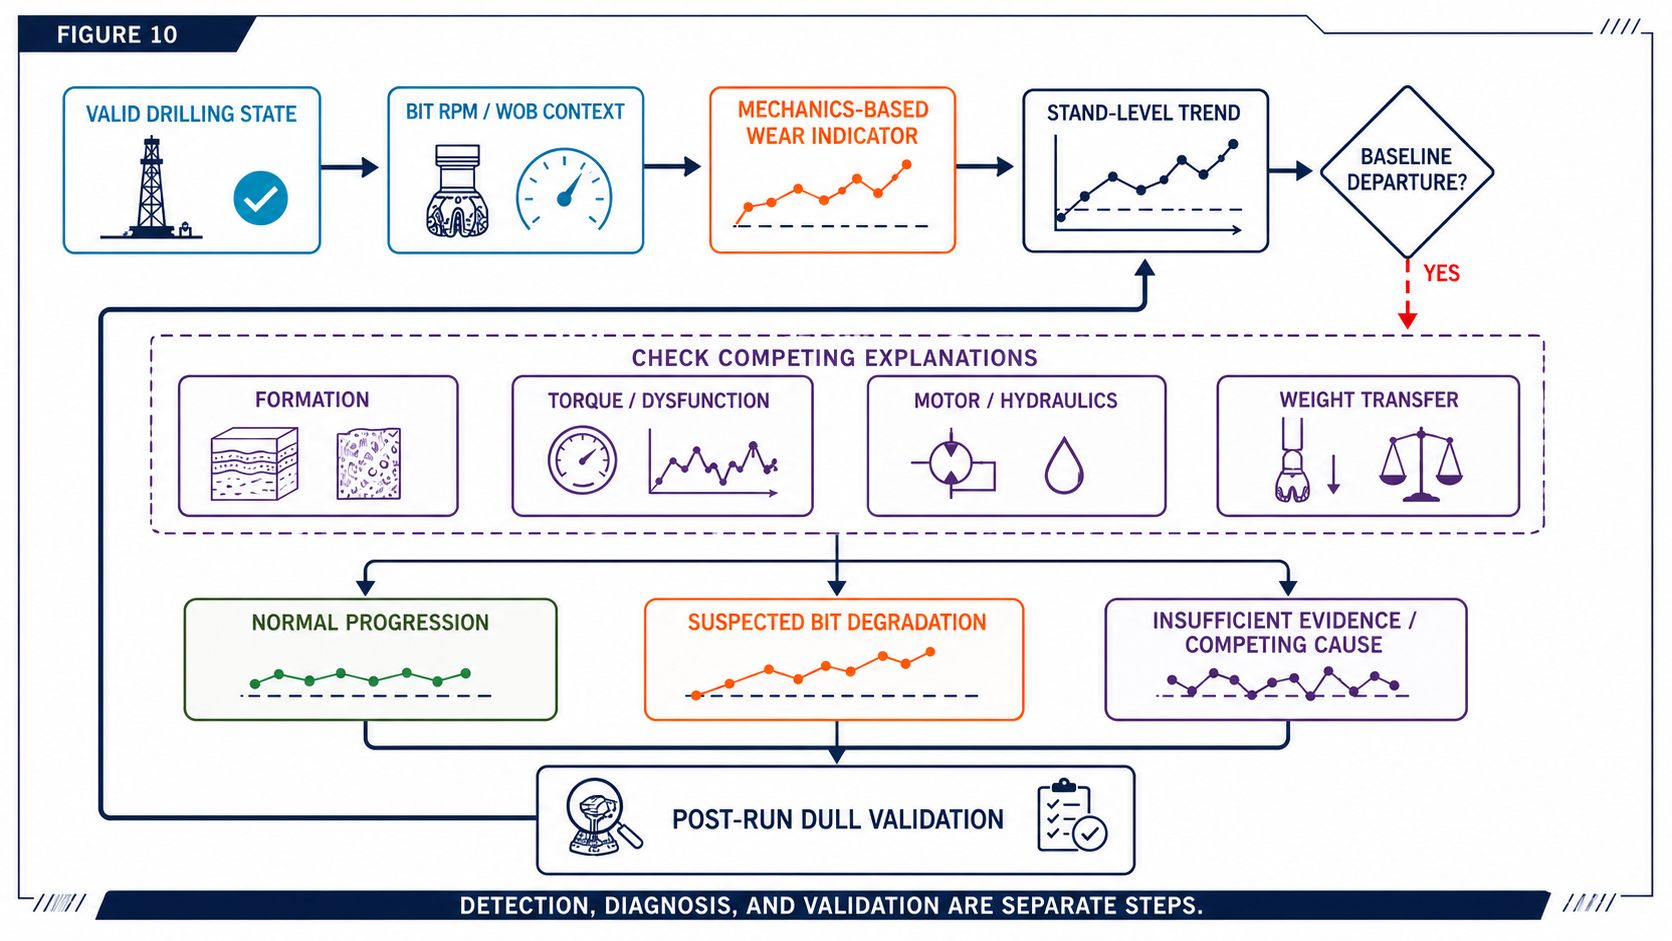
Detection identifies a departure, diagnosis evaluates competing causes, and post-run dull inspection provides the physical validation.
The Best Result Is a Trend, Not a Red Light
A simple dashboard might say:
BIT WEAR: 73%
That looks precise.
But what does 73% physically mean?
Unless it is supported by a rigorously validated calibration, such precision can be misleading.
A more useful engineering view may show:
- current wear indicator,
- baseline trend,
- departure magnitude,
- supporting evidence,
- known confounders.
That allows the engineer to understand the basis for concern.
DrillingMetrics Example: A Progressive Baseline Departure
DrillingMetrics exposes the Bit Wear Factor beside the measurements needed to interpret it rather than as an isolated red or green status.
In this anonymized Offset Traces comparison, the main well is orange and the offset well is blue. Beginning near 7,800 ft, the main-well Bit Wear Factor progressively separates from the offset. Over the same interval:
- ROP generally declines,
- depth of cut declines,
- downhole MSE increases.
The run subsequently ended with a bit trip.
That alignment is consistent with a sustained change in cutting effectiveness. It does not prove physical cutter wear or uniquely identify the cause. WOB, surface RPM, torque, differential pressure, pump rate, and pump pressure remain visible so the engineer can evaluate competing explanations.
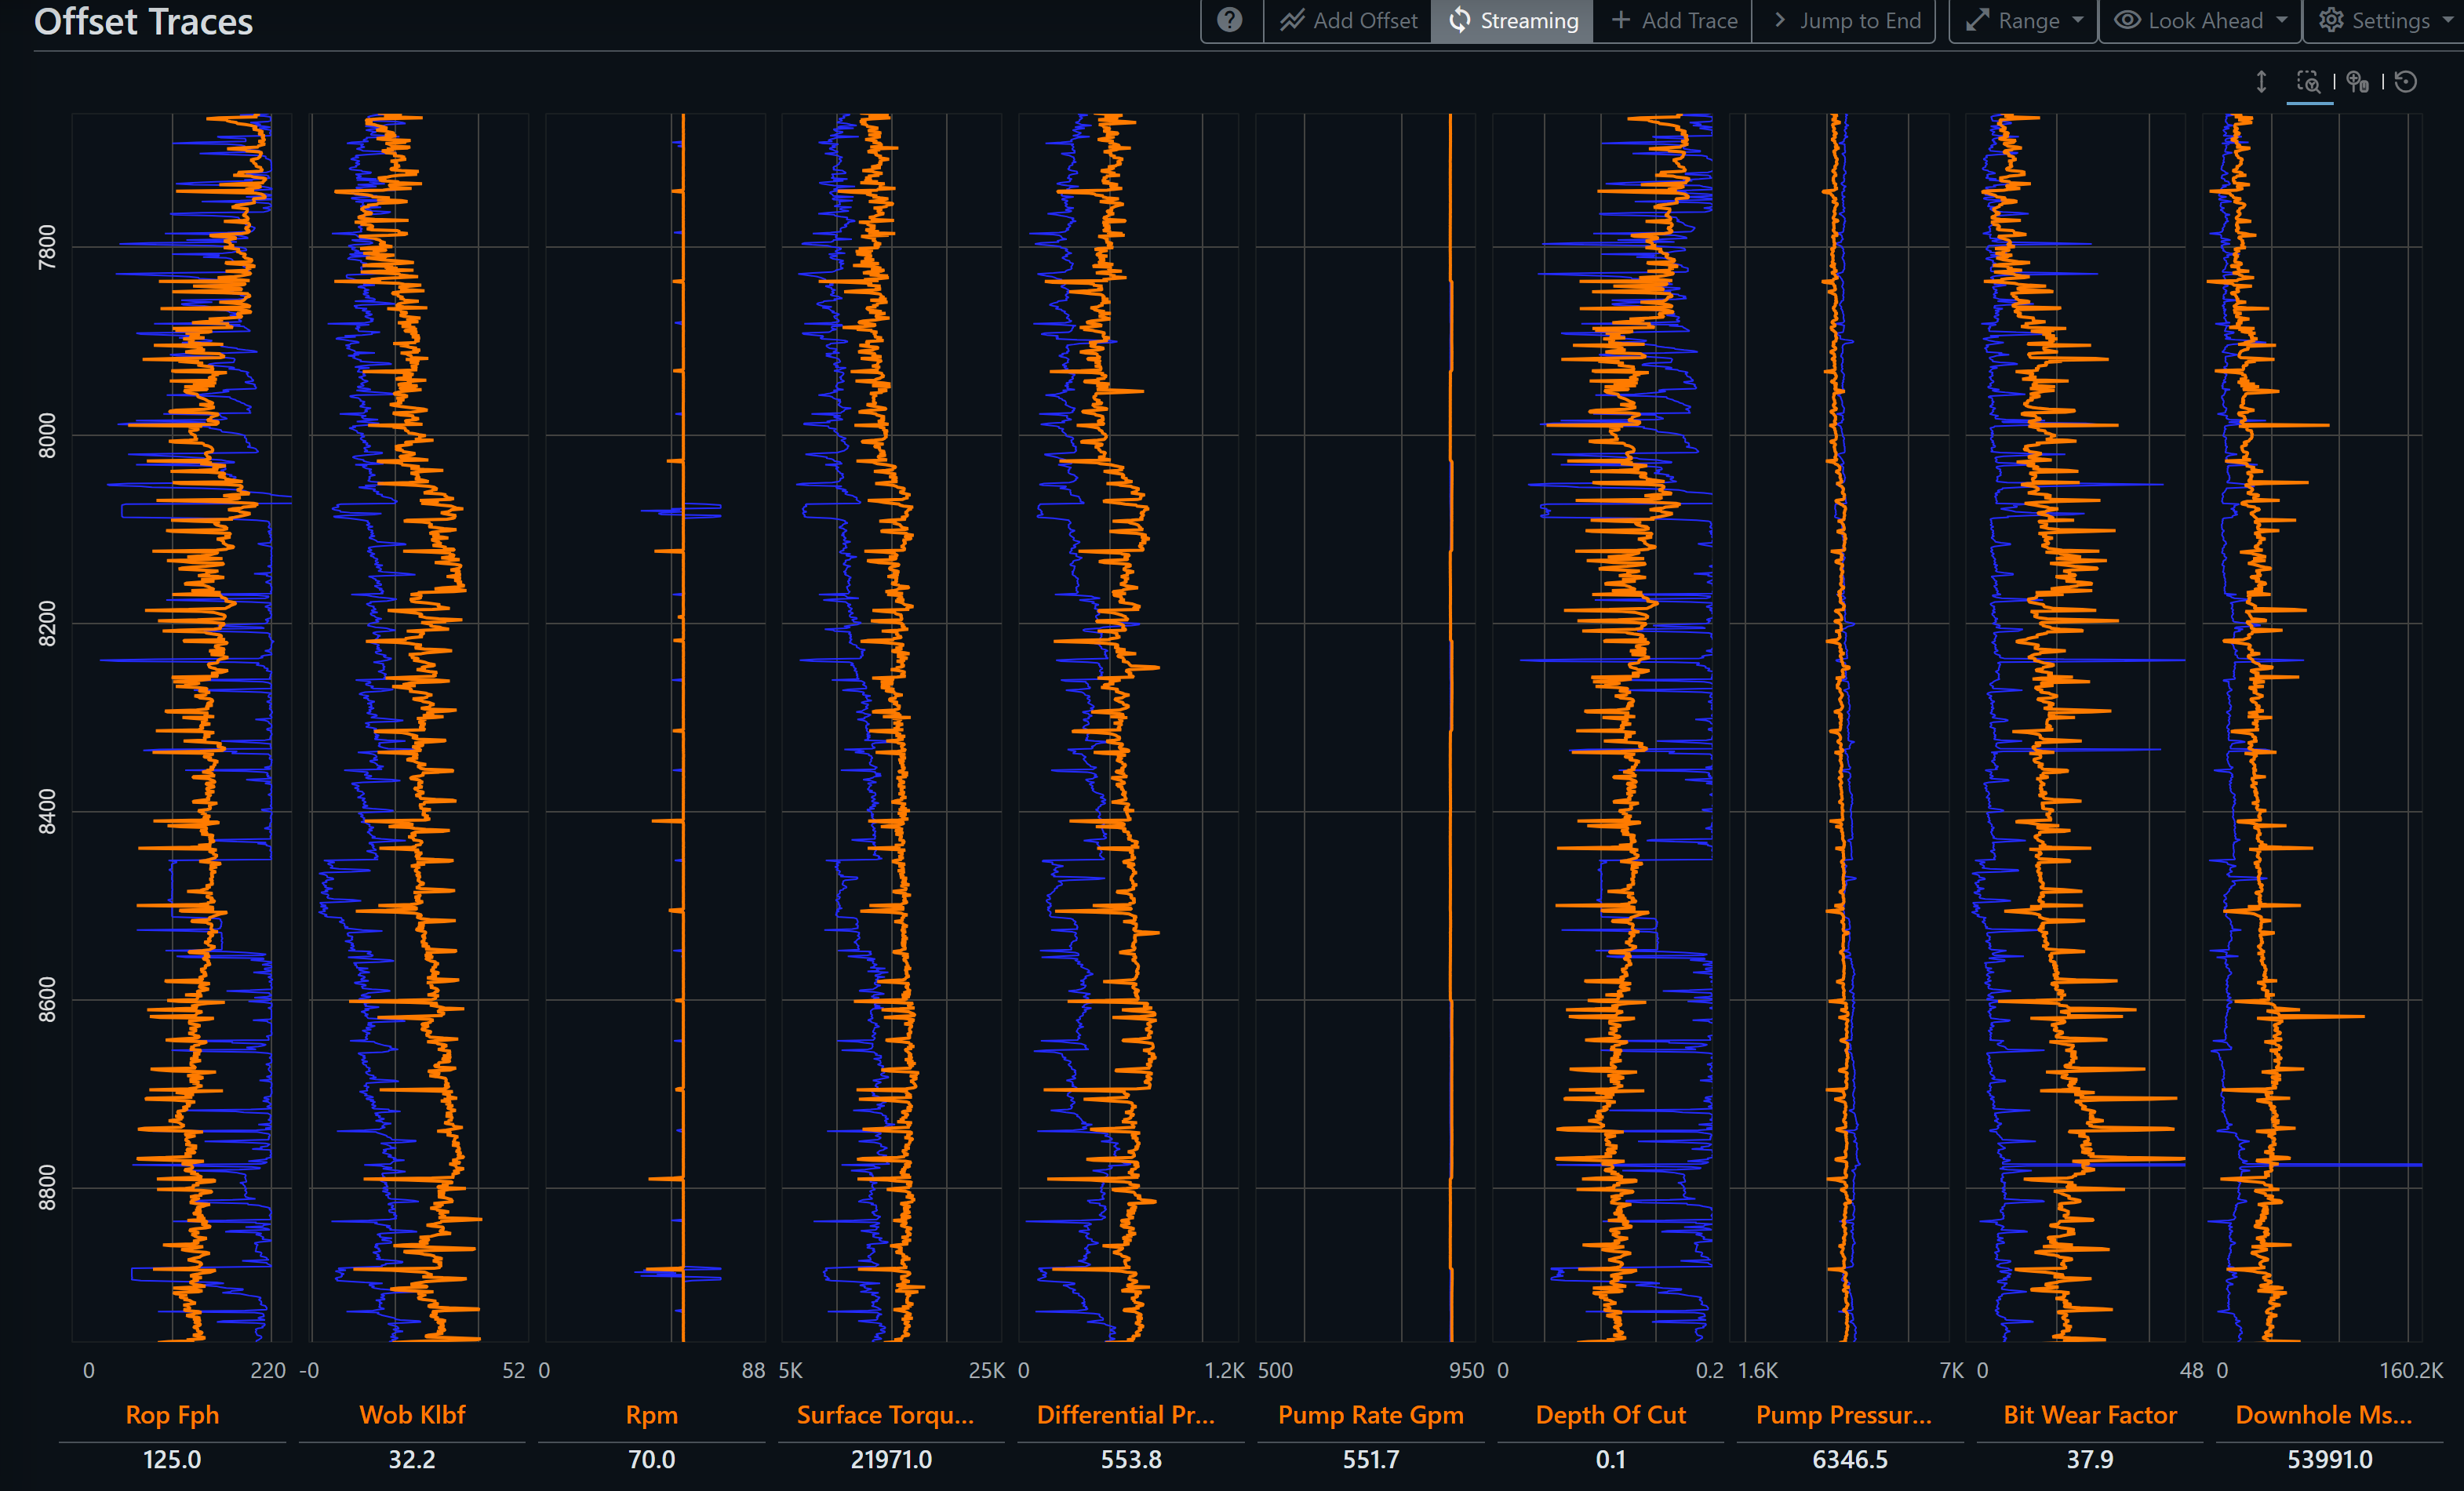
DrillingMetrics Offset Traces for an anonymized bit run. Beginning near 7,800 ft, the main-well Bit Wear Factor (orange) progressively separates from the offset well (blue). Over the same interval, ROP and depth of cut generally decline while downhole MSE increases, leading into a subsequent bit trip. The aligned trends strengthen the case for a sustained change in cutting effectiveness, but they do not directly measure cutter wear or uniquely identify its cause.
What Surface Data Can Tell Us Well
Surface data can be useful for identifying:
Changing cutting efficiency
The same or greater mechanical input produces less useful footage.
Departure from a previous bit-run trend
A stand-level relationship changes materially.
Timing of a suspected degradation event
The likely interval can be narrowed for closer investigation.
Supporting evidence of dysfunction
Torque, pressure, or other channels may reveal a plausible mechanism.
Those are valuable outputs.
What Surface Data Cannot Guarantee
Surface data generally cannot guarantee:
Exact cutter damage
It does not directly see the PDC cutting structure.
Exact wear volume
A mechanics indicator is not a physical wear gauge.
Unique root cause
Formation and dysfunction can mimic degradation.
Absence of downhole dysfunction
Some damaging dynamics may have weak surface signatures.
Those limitations should remain visible in the interpretation.
Conclusion
Surface drilling data cannot inspect a PDC cutter directly.
But it can reveal when the relationship between:
- WOB,
- bit speed,
- torque,
- ROP
begins to behave differently from what was previously expected.
That makes mechanics-based wear indicators valuable surveillance tools.
Their strongest use is not:
The bit is 63% worn.
It is:
The cutting response has departed materially from its established trend. We should investigate whether the cause is bit degradation, formation, dysfunction, or another change in the drilling system.
The distinction is important.
A surface-derived metric is an indicator.
The baseline provides context.
The raw signals provide supporting evidence.
The recovered bit provides validation.
Together, those layers create a much more defensible picture of bit condition than ROP alone.
And that is the real objective of bit-wear surveillance:
not to pretend that the rig floor can see the cutters, but to recognize when the drilling response gives us good reason to suspect that the cutters have changed.
References
-
Witt-Doerring, Y., Pastusek, P. P., Ashok, P., and van Oort, E. Quantifying PDC Bit Wear in Real-Time and Establishing an Effective Bit Pull Criterion Using Surface Sensors. SPE-205844-MS, SPE Annual Technical Conference and Exhibition, 2021.
-
Yi, M., Ashok, P., Ramos, D., Pearce, J., Hickin, G., Peroyea, T., White, S., Thetford, T., and Behounek, M. Field Deployment of a Real-Time Bit Pull Advisory System. SPE/IADC-214608-MS, SPE/IADC Middle East Drilling Technology Conference and Exhibition, Abu Dhabi, 2023.