Comparing Slide and Rotate Performance Without Misleading Averages
Rotary drilling and slide drilling create hole through different mechanical and directional processes. Combining them into one ROP average can make BHAs, wells, and crews appear better or worse for reasons unrelated to actual drilling efficiency.
Two lateral wells are completed.
Well A
Average on-bottom ROP:
200 ft/hr
Well B
Average on-bottom ROP:
155 ft/hr
It is tempting to conclude:
Well A drilled substantially better.
Now add one more piece of information.
Well A
Slide footage:
8%
Well B
Slide footage:
30%
The comparison has changed.
Perhaps both wells rotated at nearly the same ROP.
Well B may simply have required substantially more directional correction.
If so, ranking the drilling systems using whole-lateral ROP partly measures:
how much steering was required
rather than:
how efficiently each system drilled while performing the same operation.
This problem appears frequently in directional-drilling analytics because slide drilling and rotary drilling are often combined under the broad label:
on-bottom drilling.
Both make new hole.
But mechanically and operationally they are different processes.
During rotary drilling:
- surface rotation contributes to bit rotation,
- the drillstring is continuously rotating,
- surface torque has a familiar interpretation,
- WOB transfer is generally different from sliding.
During slide drilling:
- surface rotation is stopped,
- a downhole motor rotates the bit,
- toolface must be controlled,
- drillstring friction affects axial weight transfer,
- directional response becomes part of the performance objective.
SPE-186166 explicitly notes that a drilling-efficiency model designed primarily for rotary drilling was more difficult to apply to sliding because slide analysis requires additional information such as toolface angle, BHA build/drop tendency, and accurate mud-motor performance specifications.[1]
SPE-196020 provides a practical field consequence. In one lateral BHA comparison, the authors specifically noted that average ROP was reduced by increased sliding footage.[2]
The analytical lesson is simple:
Before comparing drilling performance, separate the drilling modes responsible for that performance.
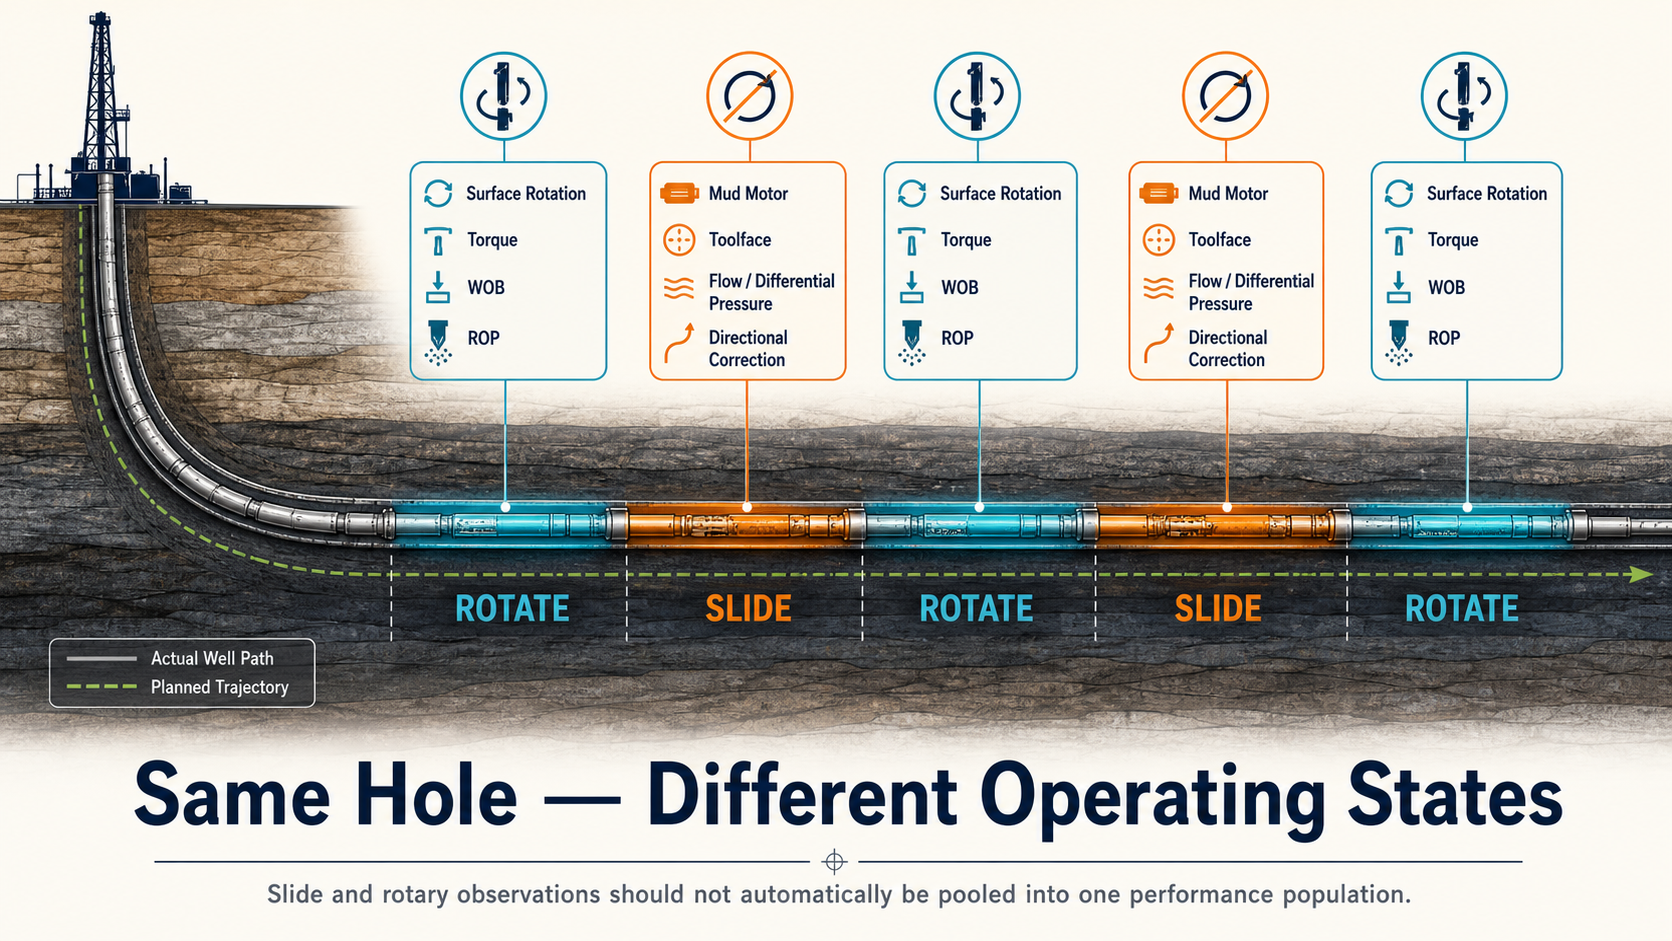
Slide and rotary drilling both create new hole, but they represent different mechanical states and should not automatically be treated as one statistical population.
Whole-Section ROP Mixes Two Different Effects
Suppose a lateral contains:
$$F_r$$
feet rotated and:
$$F_s$$
feet slid.
If rotary ROP is:
$$R_r$$
and slide ROP is:
$$R_s$$
then the drilling time is:
$$t = \frac{F_r}{R_r} + \frac{F_s}{R_s}$$
and the resulting section on-bottom ROP is:
$$R_{section} = \frac{F_r+F_s} { \frac{F_r}{R_r} + \frac{F_s}{R_s} }$$
The important consequence is that whole-section ROP depends on both:
- how fast each drilling mode performed,
- how much footage was drilled in each mode.
Those are different engineering questions.
A Simple Example
Assume two wells have exactly the same drilling performance within each mode:
Rotary ROP
$$250\ ft/hr$$
Slide ROP
$$70\ ft/hr$$
But the wells require different amounts of sliding.
Well A
90% rotate
10% slide
The resulting idealized section ROP is approximately:
$$R_A = \frac{1} { 0.90/250 + 0.10/70 } \approx 199\ ft/hr$$
Well B
70% rotate
30% slide
The resulting section ROP is:
$$R_B = \frac{1} { 0.70/250 + 0.30/70 } \approx 141\ ft/hr$$
Well A appears about:
41% faster
on whole-section ROP.
Yet:
- rotary performance is identical,
- slide performance is identical.
The entire difference comes from:
directional-mode mix.
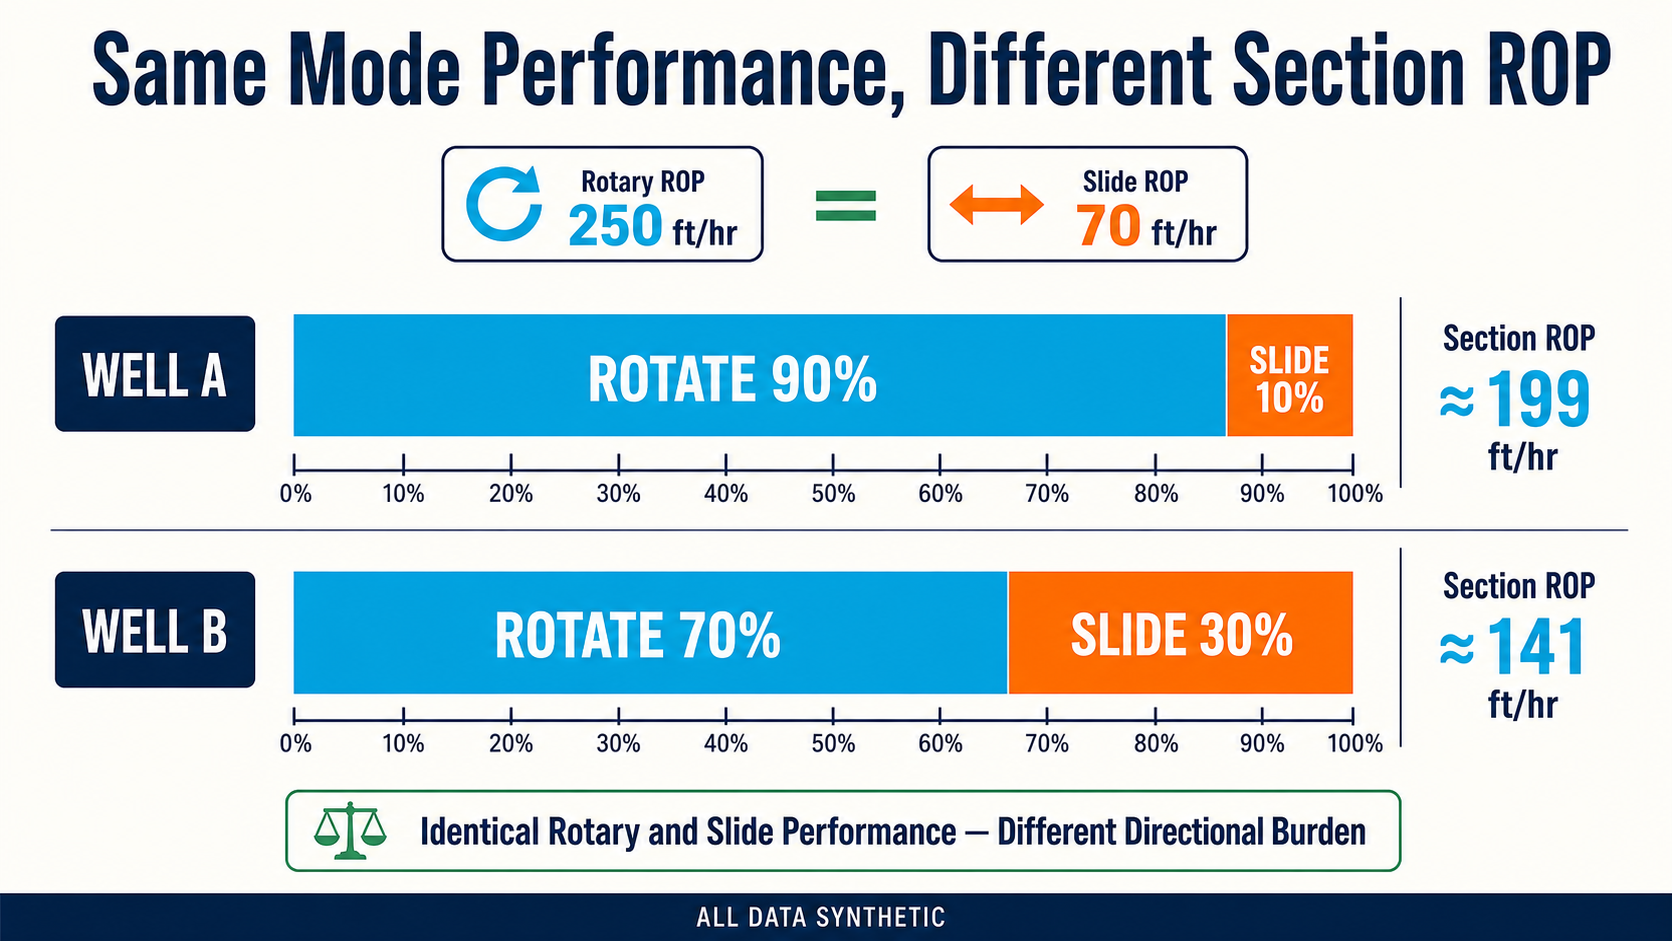
Identical mode-specific performance can produce different section ROP when the directional-mode mix changes. All data shown are synthetic.
This Does Not Make Section ROP Wrong
Whole-section ROP is still useful.
If the question is:
How quickly did we drill the section while on bottom?
then section ROP answers it directly.
The problem appears when that number is used to answer a different question:
Which BHA drilled rock more efficiently?
or:
Which driller performed better?
or:
Which well had better rotary drilling performance?
For those questions, the mode mix becomes a confounding variable.
The statistic is not wrong.
The interpretation is.
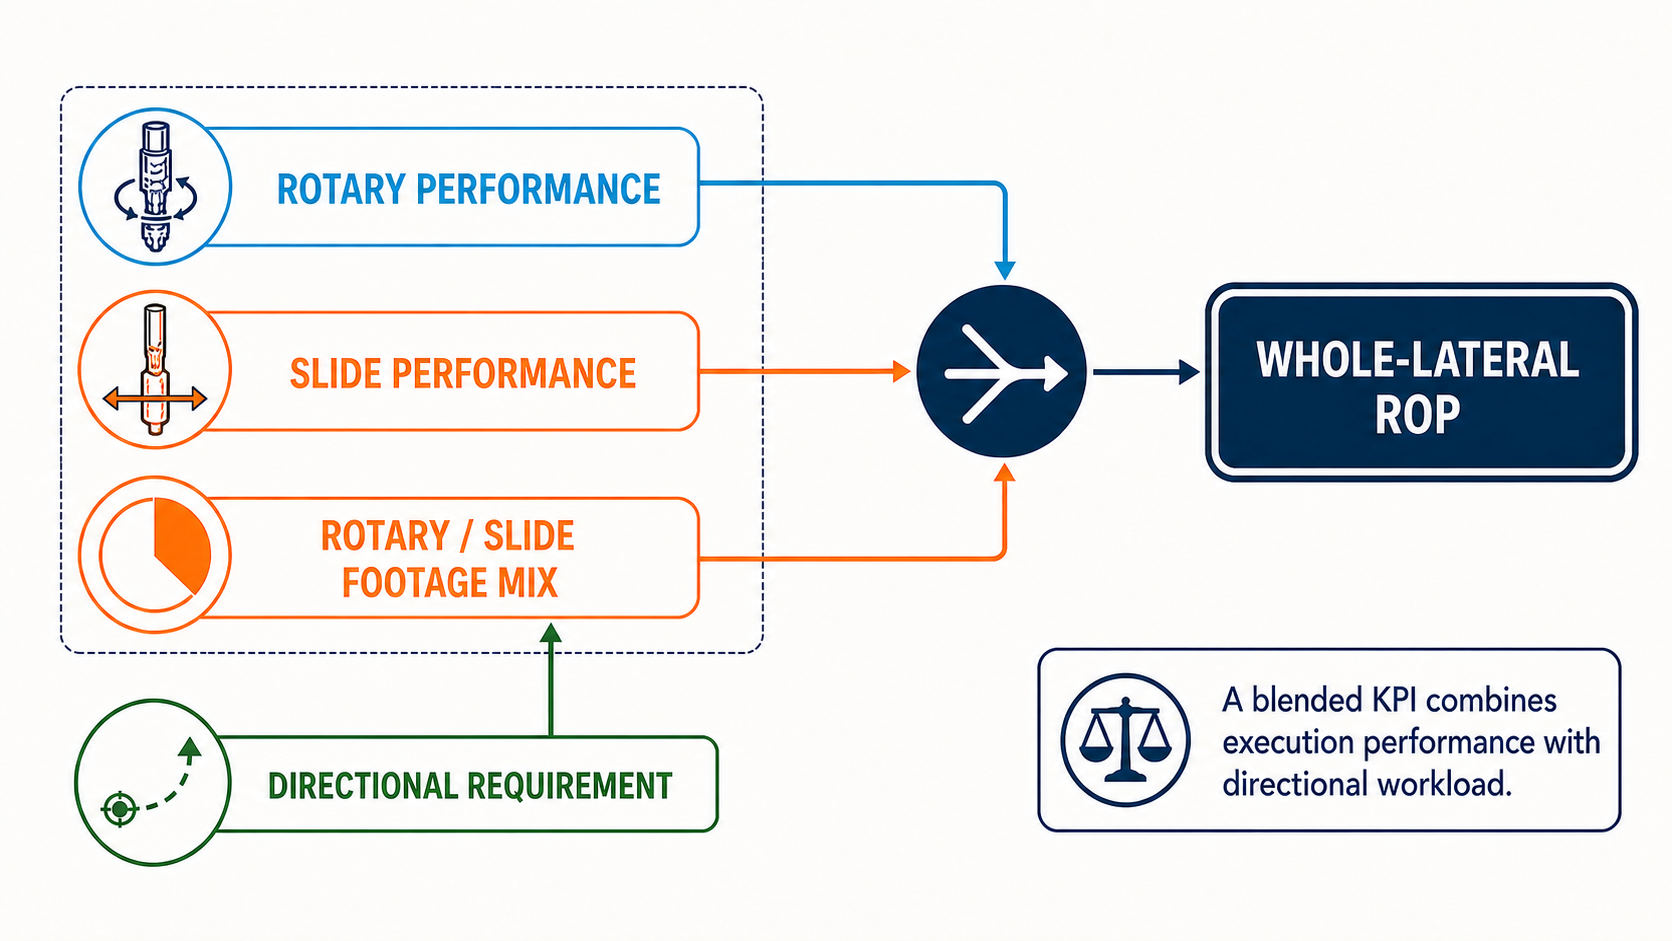
Whole-lateral ROP combines rotary efficiency, slide efficiency, and the footage mix created by directional requirements.
Slide Footage Represents Directional Work
Sliding is generally performed because the well needs directional correction.
That may involve:
- increasing inclination,
- decreasing inclination,
- turning azimuth,
- correcting a tendency,
- returning toward plan.
The slide therefore produces two things simultaneously:
- new hole,
- directional change.
A slide with lower ROP may still be highly successful if it delivers the required directional correction efficiently.
This creates an important distinction between:
penetration performance
and:
directional performance.
A slide should not be evaluated using ROP alone.
A Fast Slide That Does Not Steer Is Not Necessarily Good
Imagine two slides.
Slide A
ROP:
90 ft/hr
But the achieved directional response is weak.
The directional driller must slide:
150 ft
to obtain the required correction.
Slide B
ROP:
65 ft/hr
But the BHA responds strongly.
Only:
70 ft
of slide is required.
Which slide was better?
ROP alone favors Slide A.
Total directional execution may favor Slide B.
The useful question becomes:
How much time and footage were required to achieve the necessary trajectory change?
That is a more complete directional-performance question.
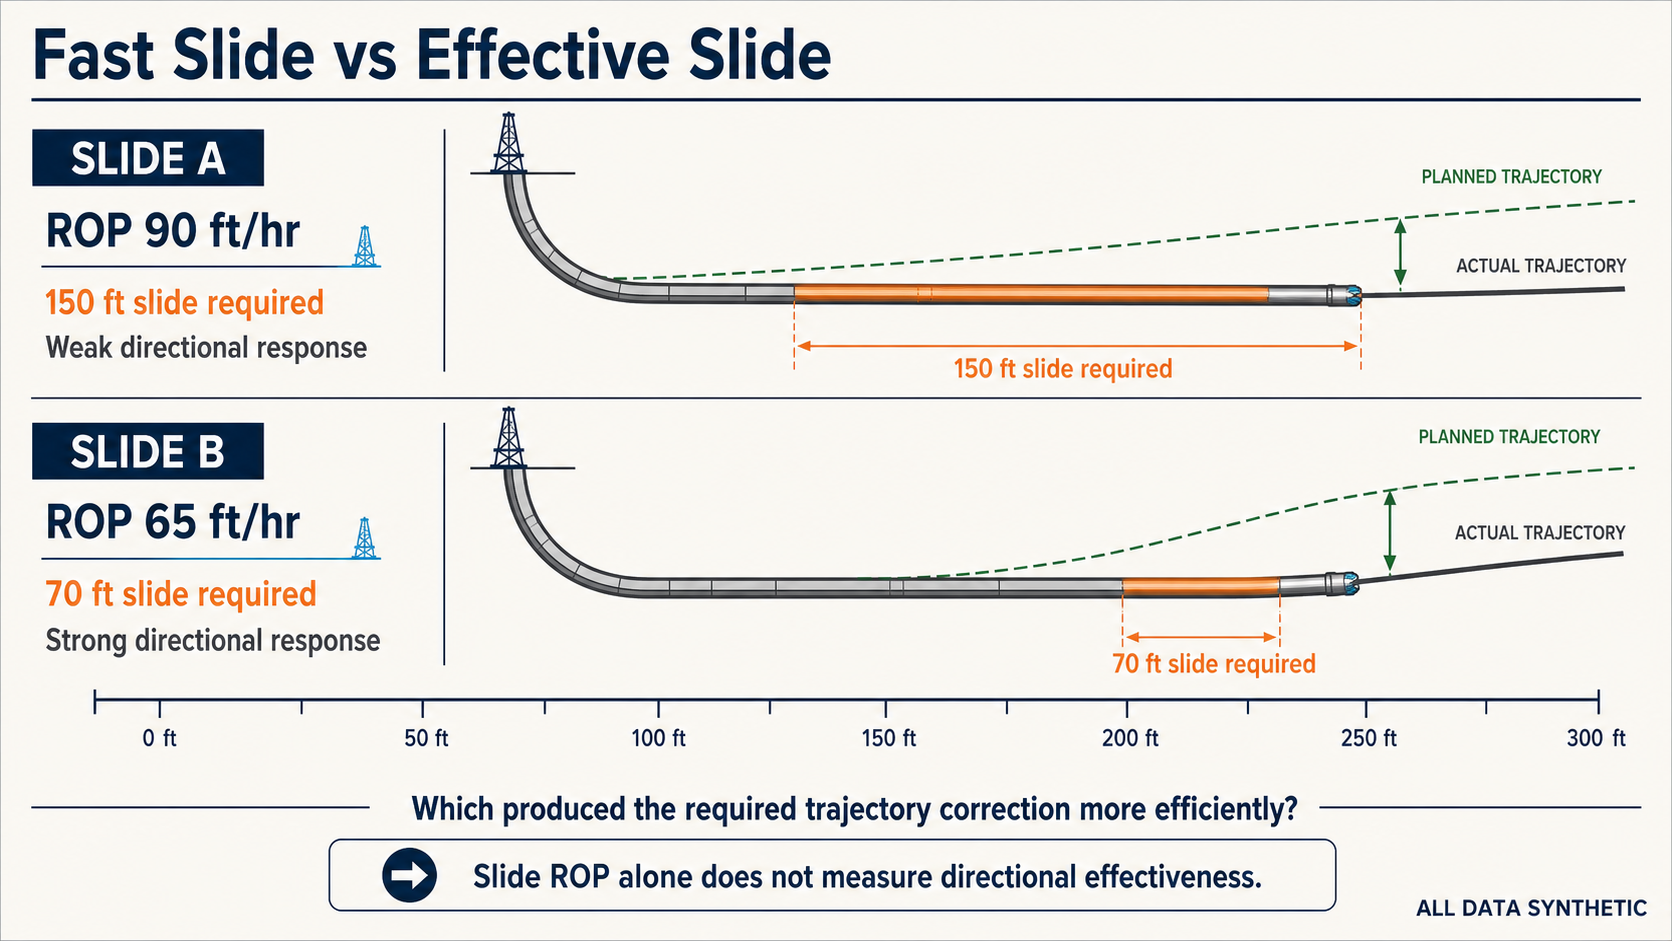
Slide ROP alone does not establish how efficiently a slide delivered the required trajectory correction. All data shown are synthetic.
Directional Requirement Is Part of the Denominator
Suppose two wells use identical BHAs.
Well A follows the planned trajectory smoothly and requires:
700 ft of slide
through the lateral.
Well B encounters stronger formation tendency and requires:
2,000 ft of slide.
If the slide ROP is identical, Well B will still have substantially worse whole-lateral ROP.
Is the BHA worse?
Not necessarily.
Is the driller worse?
Not necessarily.
The wells may simply have had different directional workloads.
This is why crew, BHA, and vendor comparisons should not rank whole-lateral ROP without accounting for directional requirement.
Rotary Drilling Is Mechanically Easier to Benchmark
Rotary drilling is usually the cleaner population for evaluating:
- WOB,
- surface RPM,
- surface torque,
- ROP,
- MSE.
That is why several published drilling studies deliberately restrict their analysis to rotary drilling.
SPE-205844, for example, filtered sliding and off-bottom intervals from its PDC wear analysis and calculated stand-level statistics only while rotating on bottom.[3]
The authors specifically noted that sliding was excluded because high surface WOB during sliding was not considered a reliable indication of formation hardness for that analysis.
This is an important methodological example.
The study did not assume one mechanical model was equally valid in every drilling state.
It selected the state where its assumptions were most defensible.
Surface RPM Means Something Different While Sliding
During rotary drilling:
$$RPM_{surface} > 0$$
and a mud motor may add additional bit RPM.
During slide drilling:
$$RPM_{surface}=0$$
but:
$$RPM_{bit}>0$$
because the mud motor continues rotating the bit.
Therefore a comparison such as:
Well A drilled at 120 RPM while Well B slid at 0 RPM
is physically misleading.
The second bit was not stationary.
Its rotational speed was being generated downhole.
A simplified motor-speed estimate is often based on:
$$RPM_{motor} \approx Q \times RPG$$
where:
- $$Q$$ = flow rate,
- $$RPG$$ = motor revolutions per gallon.
So the relevant rotational context during a slide includes:
- flow,
- motor specification,
- differential pressure,
- motor condition.
This is fundamentally different from a surface-RPM comparison.
Surface WOB Also Changes Interpretation
Sliding changes axial-force transfer.
Without continuous drillstring rotation, friction can make surface WOB less representative of the load actually reaching the bit.
The earlier surface-versus-downhole article covered this mechanical issue in detail.
For performance benchmarking, the practical consequence is:
surface WOB should not automatically carry the same interpretation in slide and rotary populations.
SPE-205844 explicitly treated surface WOB equivalence as a broad assumption for rotary drilling while excluding sliding from its methodology.[3]
Again, this is not evidence that surface WOB becomes useless during sliding.
It means the measurement basis should be understood.
Slide Performance Requires Directional Context
SPE-186166 identifies several examples of information needed for more complete slide analysis:
- toolface angle,
- BHA build/drop tendencies,
- accurate mud-motor performance specifications.[1]
This is important because slide performance is not just a mechanical cutting problem.
It is a controlled directional process.
Two slides at identical:
- WOB,
- flow,
- differential pressure
can produce different directional outcomes because of:
- toolface control,
- formation tendency,
- BHA response,
- friction,
- motor behavior.
That is why applying a rotary performance model unchanged to sliding can be misleading.
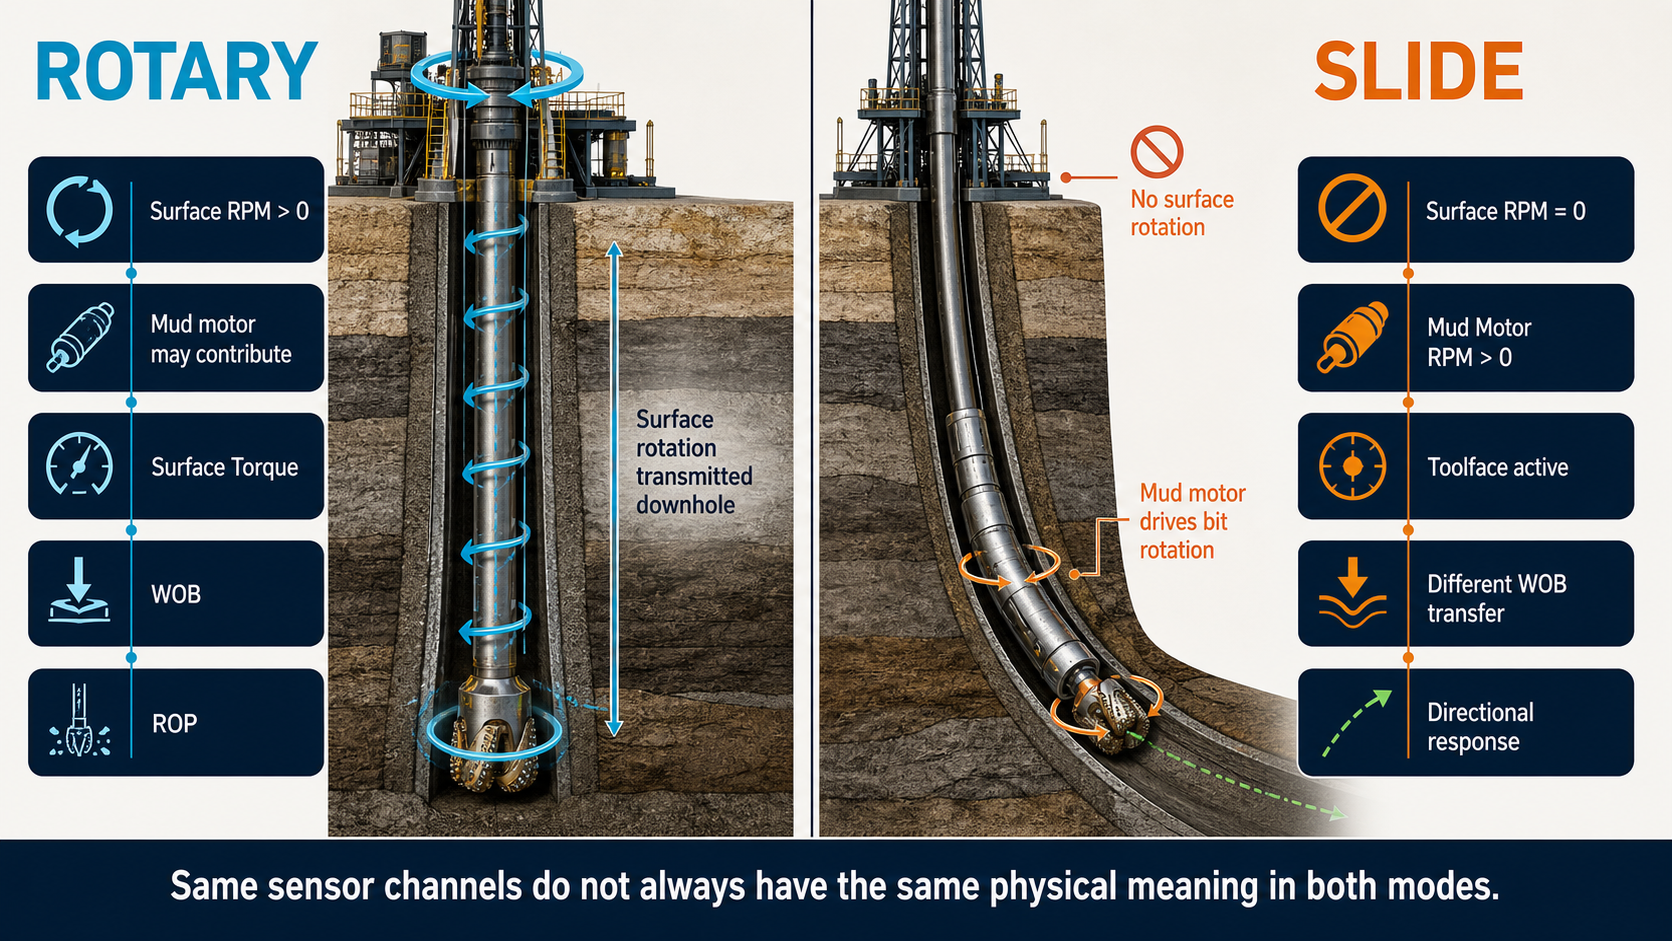
The same sensor channels can represent different downhole mechanics during rotary and slide drilling.
Toolface Is a Circular Variable
Directional data introduces another statistical complication.
Toolface is angular.
Suppose measurements are:
$$359^\circ,\ 1^\circ,\ 2^\circ$$
The ordinary arithmetic mean is:
$$120.7^\circ$$
which is obviously wrong.
The values are actually clustered around:
$$0^\circ$$
because angles wrap around at 360°.
Toolface statistics therefore require circular treatment.
That matters when evaluating:
- average toolface,
- toolface variation,
- stability around a commanded orientation.
A generic arithmetic average can make excellent toolface control look terrible.
This is another example of why slide analytics requires domain-specific data processing rather than ordinary tabular averages.
Slide Length Also Changes the Statistical Population
Suppose one directional driller performs:
- twenty short slides.
Another performs:
- five long slides.
If each slide is treated as one equally weighted observation, both contribute the same number of events despite very different footage.
Possible analytical units include:
- individual samples,
- slide events,
- footage slid,
- stands containing slides.
Each answers a different question.
Event-weighted
Useful for:
What does a typical slide event look like?
Footage-weighted
Useful for:
What conditions were experienced over most of the actual slide footage?
Time-weighted
Useful for:
What consumed drilling time?
The chosen weighting should match the engineering question.
One Slow Long Slide Can Dominate Section Performance
This becomes important when examining averages.
Imagine ten slides:
Nine slides:
- 20 ft each,
- 80 ft/hr.
One slide:
- 200 ft,
- 35 ft/hr.
A simple average of the ten slide ROP values gives large statistical weight to the nine short slides.
But the long slow slide consumes much more actual drilling time.
A section-performance calculation will correctly reflect that.
Therefore:
event-average slide ROP
and:
footage/time-based slide performance
can differ significantly.
Neither is inherently wrong.
They describe different properties of the operation.
Separate the Questions Before Calculating the KPIs
A useful directional performance framework starts with the question.
Question 1
How fast did the lateral drill overall?
Use:
section footage / total drilling time
Question 2
How efficiently did we drill while rotating?
Use:
rotary-only performance
Question 3
How efficiently did we make hole while sliding?
Use:
slide-only performance
Question 4
How much directional work was required?
Use:
- slide footage,
- slide percentage,
- number and length of slides,
- planned versus actual trajectory context.
Question 5
How effective were the slides?
Use:
- achieved directional response,
- toolface behavior,
- slide length/time,
- relevant BHA expectations.
Trying to answer all five with:
Average lateral ROP
creates unnecessary confusion.
Slide Percentage Is Useful—but Also Incomplete
Slide percentage is one of the easiest directional KPIs:
$$Slide% = \frac{Slide\ Footage} {Total\ Drilled\ Footage} \times100$$
It gives valuable context.
A 10%-slide lateral and a 35%-slide lateral should not normally be benchmarked identically.
But slide percentage does not tell us why the slides occurred.
High slide percentage can result from:
- formation tendency,
- BHA tendency,
- aggressive trajectory design,
- poor toolface control,
- inefficient slide execution,
- corrective steering after earlier trajectory error.
So:
high slide percentage
is a starting point for investigation.
Not a diagnosis.
Planned Geometry Matters
A lateral requiring frequent azimuth correction should not be benchmarked against an exceptionally straight lateral without acknowledging that difference.
Likewise:
- planned build/drop tendency,
- geosteering corrections,
- geological structural changes
may legitimately require more steering.
Performance normalization should therefore distinguish:
required directional work
from:
avoidable directional work.
The first is part of the well design or geological reality.
The second may represent an improvement opportunity.
BHA Tendency Changes the Amount of Slide Required
SPE-196020 examined more than 300 BHA runs and used BHA modeling and historical data to investigate how factors such as:
- bit characteristics,
- motor geometry,
- stabilizer placement,
- formation
affect directional performance.[2]
A BHA with a relatively neutral rotary tendency may hold trajectory with relatively little slide footage.
Another may continuously build or drop while rotating and therefore require frequent corrections.
If the second BHA produces lower whole-lateral ROP, part of the difference may come from:
its directional tendency
rather than:
its ability to cut rock while rotating.
That distinction is extremely important in BHA benchmarking.
A Higher Rotary ROP Can Still Produce a Slower Lateral
Consider:
BHA A
Rotary ROP:
250 ft/hr
Slide ROP:
65 ft/hr
Slide percentage:
30%
BHA B
Rotary ROP:
225 ft/hr
Slide ROP:
65 ft/hr
Slide percentage:
10%
Using the same idealized calculation:
BHA A
$$R_{section} \approx \frac{1} {0.70/250+0.30/65} \approx 135\ ft/hr$$
BHA B
$$R_{section} \approx \frac{1} {0.90/225+0.10/65} \approx 181\ ft/hr$$
BHA A drills faster while rotating.
Yet BHA B delivers the section faster because it requires much less sliding.
Which BHA is better?
That depends on the objective.
This is precisely why directional performance needs multiple KPIs.
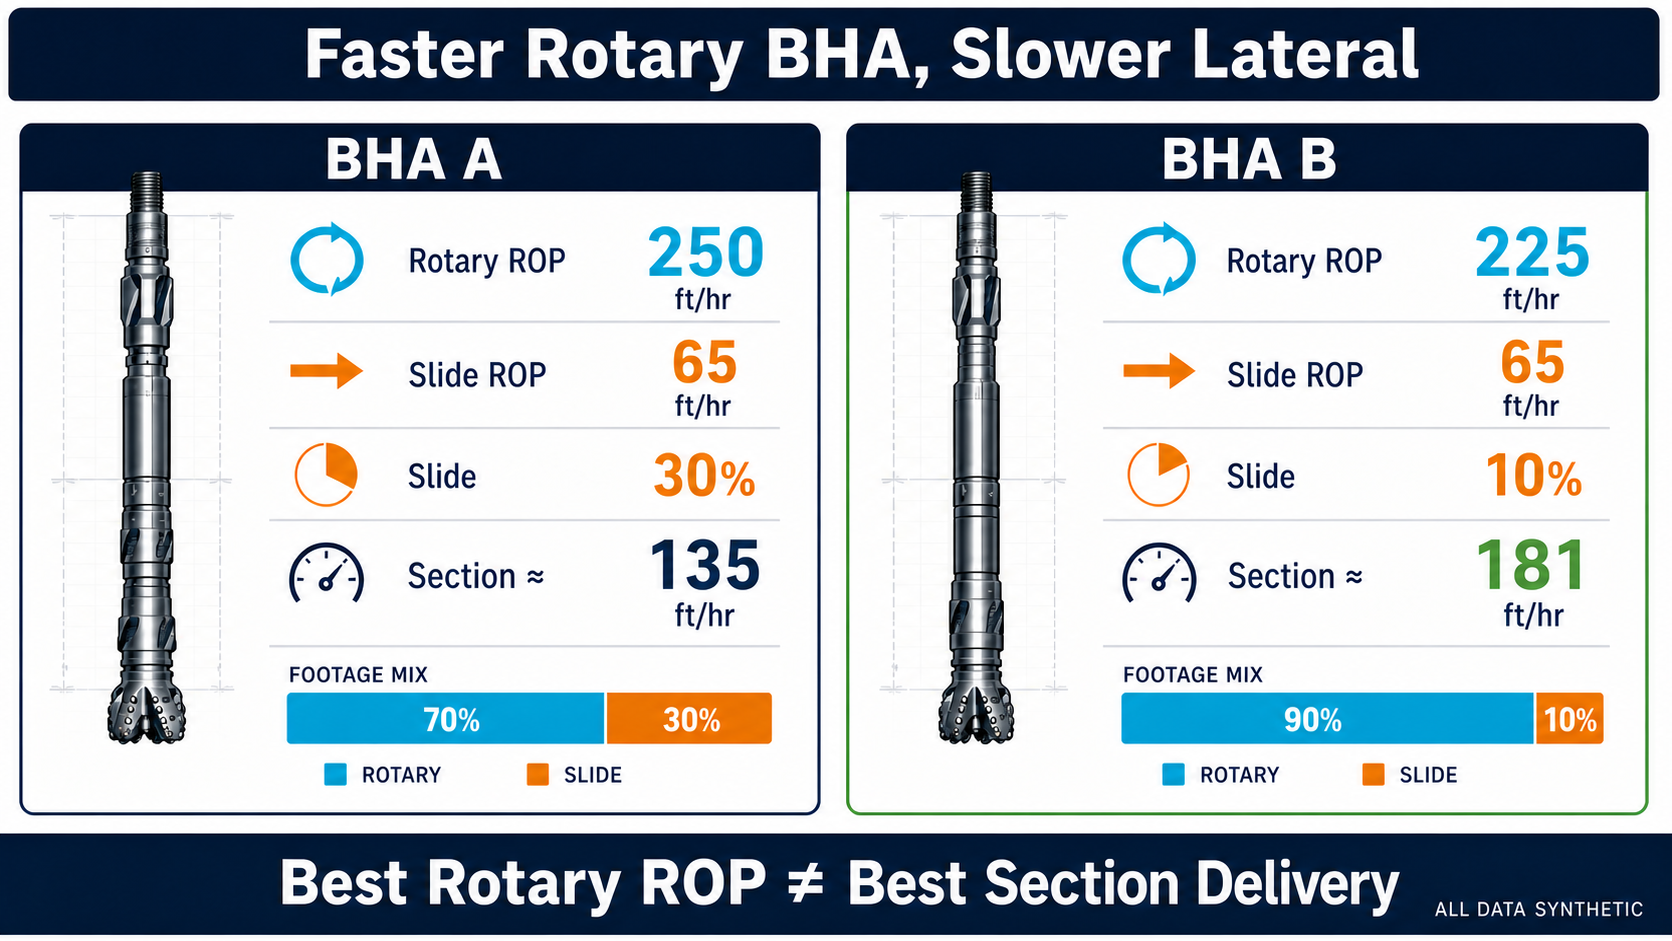
A higher rotary ROP does not guarantee faster section delivery when the BHA requires more sliding. All data shown are synthetic.
ROP and Wellbore Quality Can Also Conflict
SPE-196020 provides several useful field examples showing that ROP ranking and tortuosity ranking do not necessarily agree.[2]
One case produced the best ROP within a group while ranking worst on tortuosity.
Another well had a lower average ROP but substantially stronger wellbore-quality performance.
That does not mean lower ROP creates better wellbores.
It means:
one metric cannot fully rank a directional BHA.
Useful BHA performance may include:
- ROP,
- slide requirement,
- trajectory quality,
- tortuosity,
- casing deliverability,
- drilling dysfunction.
The correct optimization target is broader than drilling speed.
More Sliding Can Be the Correct Decision
There is a subtle behavioral risk in displaying slide percentage as a performance score.
If lower slide percentage is always treated as better, the metric may unintentionally encourage:
- delayed corrections,
- insufficient directional response,
- staying off plan too long.
Sometimes the correct operational decision is to slide.
The performance problem is not:
We slid 100 ft.
It is:
Did we obtain the required directional correction efficiently and without creating unnecessary future work?
A KPI should never incentivize avoiding a necessary operation.
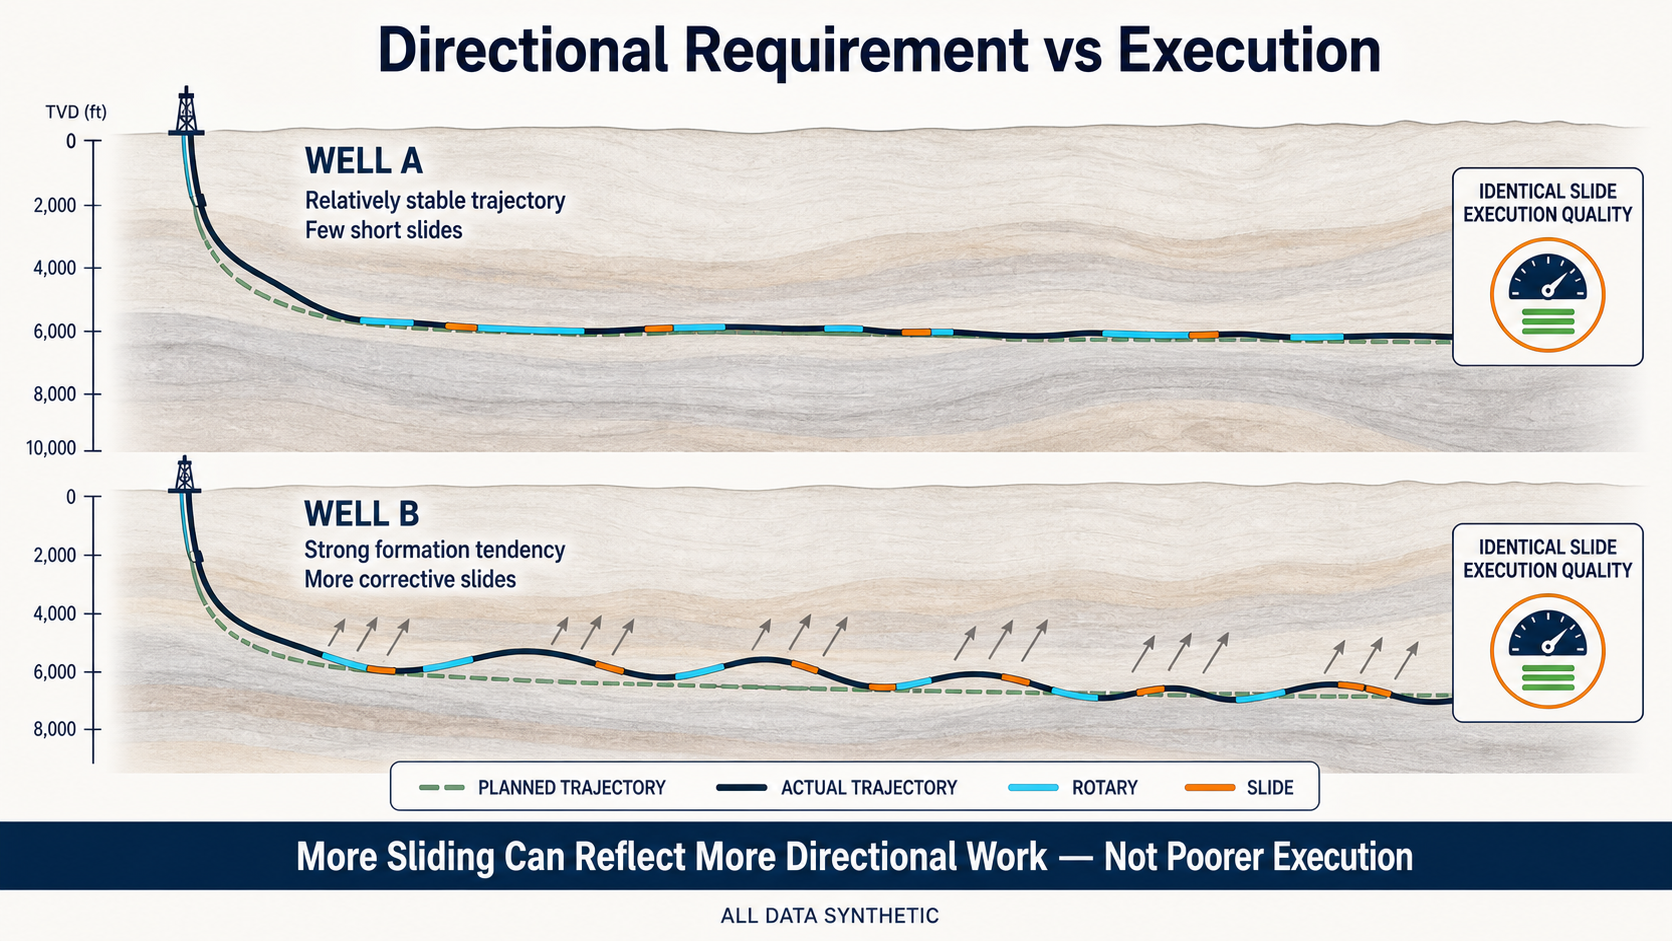
Additional sliding may reflect stronger formation tendency and greater required directional work—not poorer execution. All data shown are synthetic.
A Good Slide Can Save Future Slide Footage
Suppose an early 60-ft slide puts the well back near the planned trajectory.
The alternative is avoiding that slide.
Several stands later, the deviation grows.
Now a 250-ft corrective slide is required.
The early slide had an immediate ROP penalty.
It may have produced a much better total outcome.
This is why directional analytics benefits from looking across several stands rather than judging each slide independently.
Directional Performance Has Memory
Rotary drilling can create a tendency that accumulates gradually.
A single stand may appear acceptable.
Over several stands:
- inclination drifts,
- azimuth walks,
- positional error grows.
The need for a slide later may therefore originate from rotary behavior earlier.
Assigning all lost performance to the later slide can misidentify the underlying cause.
A complete analysis should connect:
$$Rotary\ Tendency \rightarrow Trajectory\ Departure \rightarrow Corrective\ Slide$$
This converts slide percentage from a simple operational statistic into part of a directional-performance story.
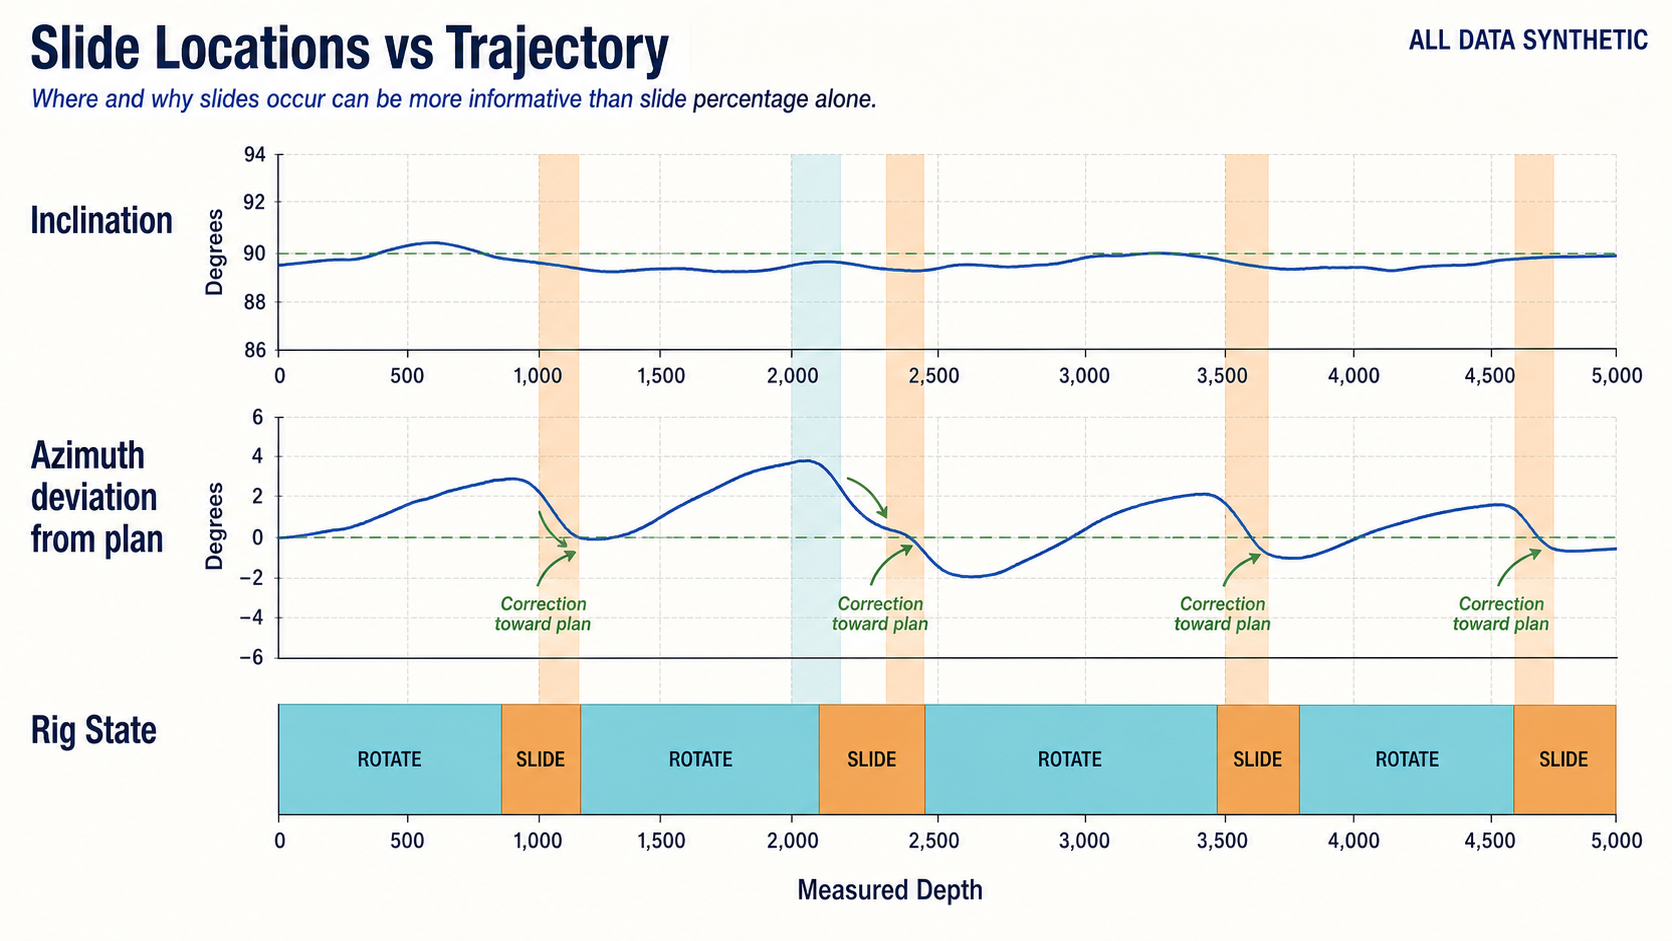
Slide location and trajectory response can explain more than slide percentage alone. All data shown are synthetic.
Compare Like With Like
A fair slide-performance benchmark should ideally compare observations with similar:
- hole section,
- inclination,
- formation,
- motor/BHA,
- flow range,
- directional objective.
Likewise, rotary performance should compare:
- rotary with rotary,
- similar formation,
- similar bit/BHA condition.
The broader benchmarking rule remains:
Normalization should happen before ranking.
A Practical Three-Layer Performance Model
One useful way to organize lateral performance is into three levels.
Level 1 — Mode Performance
How well does each drilling mode perform?
Rotary
- rotary ROP
- MSE
- torque behavior
Slide
- slide ROP
- toolface behavior
- directional response
Level 2 — Directional Burden
How much of each mode was required?
- slide footage,
- slide percentage,
- number and length of slides.
Level 3 — Section Outcome
What did the combined operation deliver?
- total drilling time,
- overall on-bottom ROP,
- trajectory quality,
- tortuosity.
This structure prevents one blended statistic from hiding the reason a section was fast or slow.
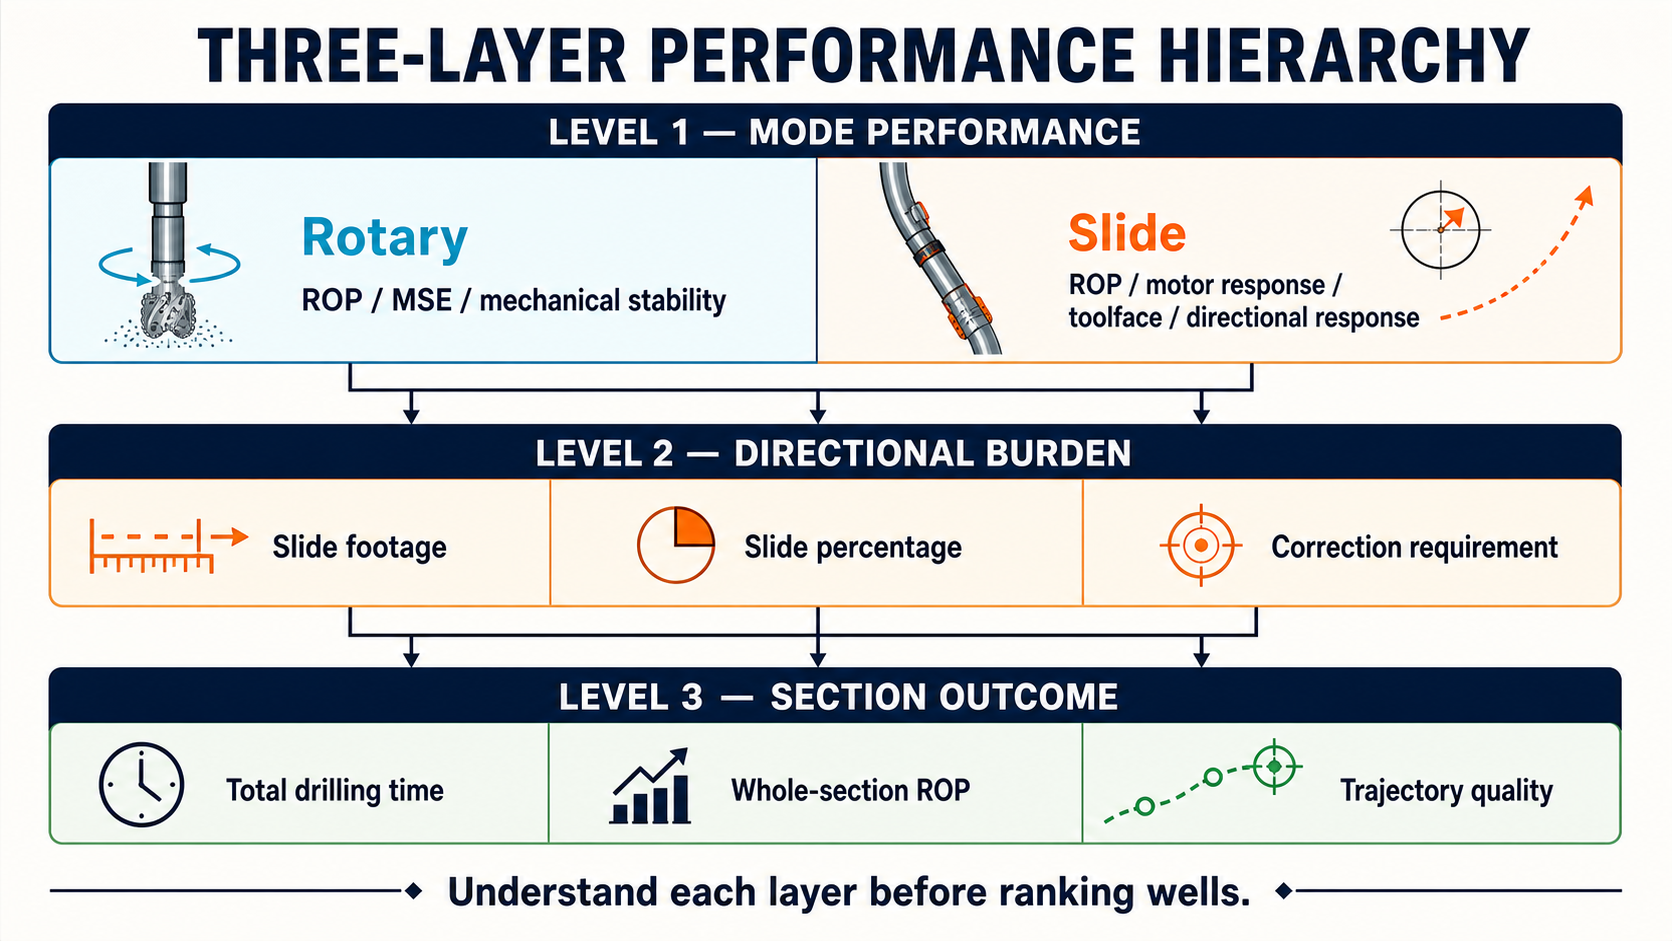
Separate mode performance, directional burden, and section outcome before ranking wells.
A Practical Example
Consider two hypothetical 9,000-ft laterals.
Well A
Rotary:
- 7,920 ft
- 240 ft/hr
Slide:
- 1,080 ft
- 70 ft/hr
Slide percentage:
12%
Well B
Rotary:
- 6,750 ft
- 225 ft/hr
Slide:
- 2,250 ft
- 72 ft/hr
Slide percentage:
25%
A simple whole-lateral average strongly favors Well A.
But now investigate the directional context.
Well A
- relatively neutral rotary tendency,
- small number of corrections,
- normal planned geometry.
Well B
- strong formation walk,
- several geosteering corrections,
- greater required directional work.
Now ask two different questions.
Which drilling system rotated faster?
Well A.
Which well required less directional work?
Well A.
But can we conclude:
The crew on Well B executed sliding poorly?
No.
The available information does not support that conclusion.
To answer it we would need to examine:
- slide ROP,
- achieved directional response,
- toolface control,
- BHA tendency,
- planned versus required trajectory.
This is the difference between:
performance ranking
and:
engineering diagnosis.
Decomposing the Lateral in DrillingMetrics
DrillingMetrics makes the distinction visible by moving from the blended section result to individual slide intervals and then to the measured directional response.
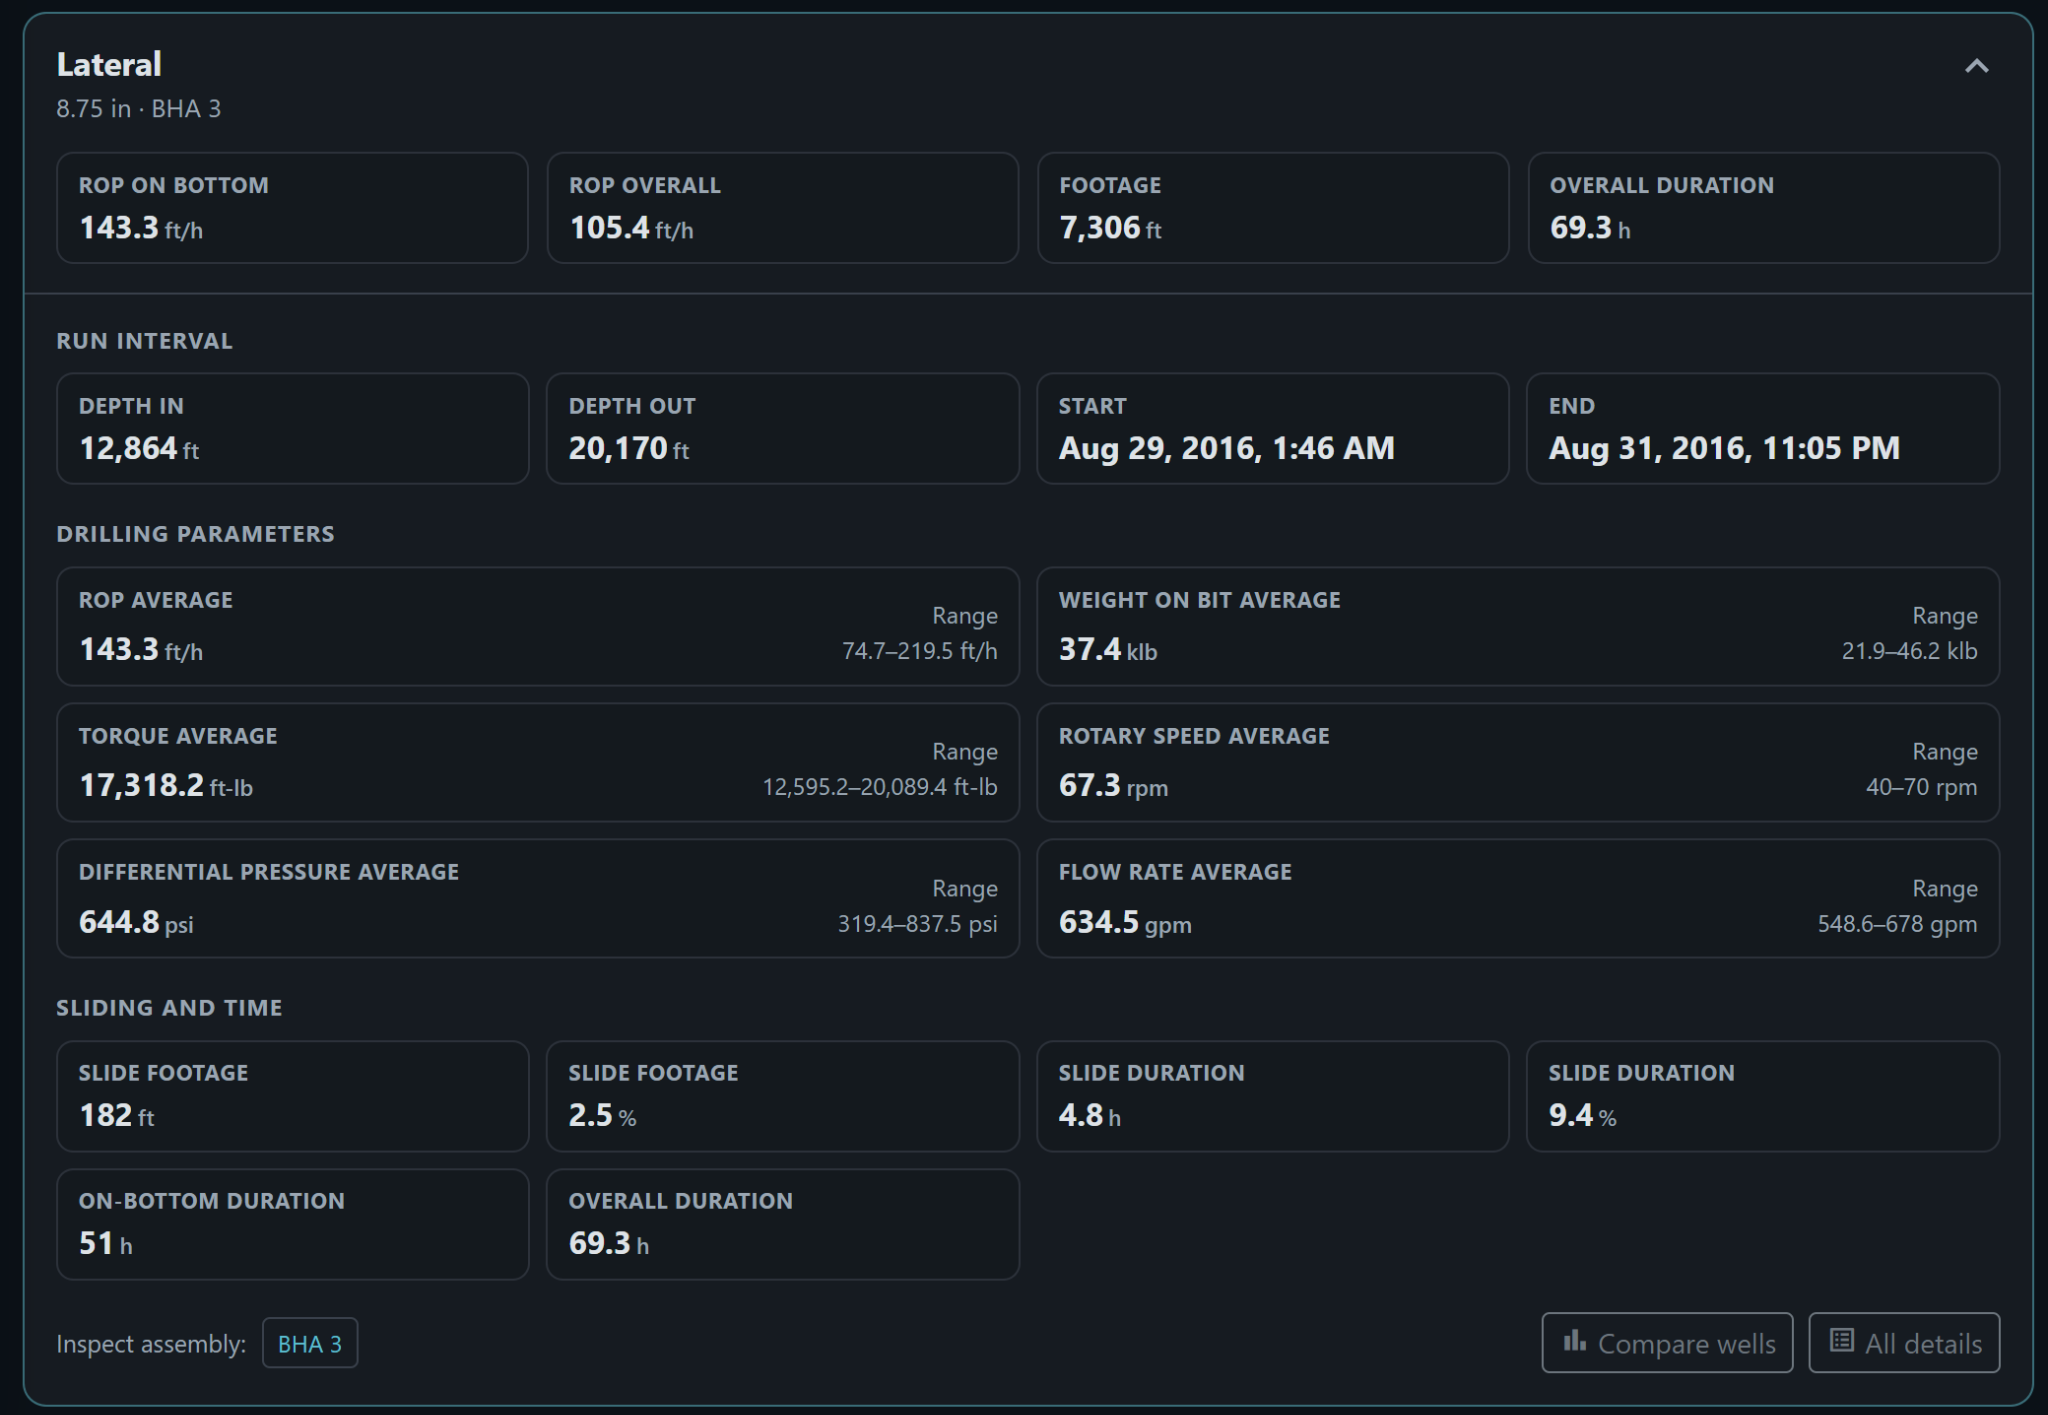
The DrillingMetrics run record summarizes lateral performance, drilling parameters, slide footage, slide percentage, and duration in one operational context.
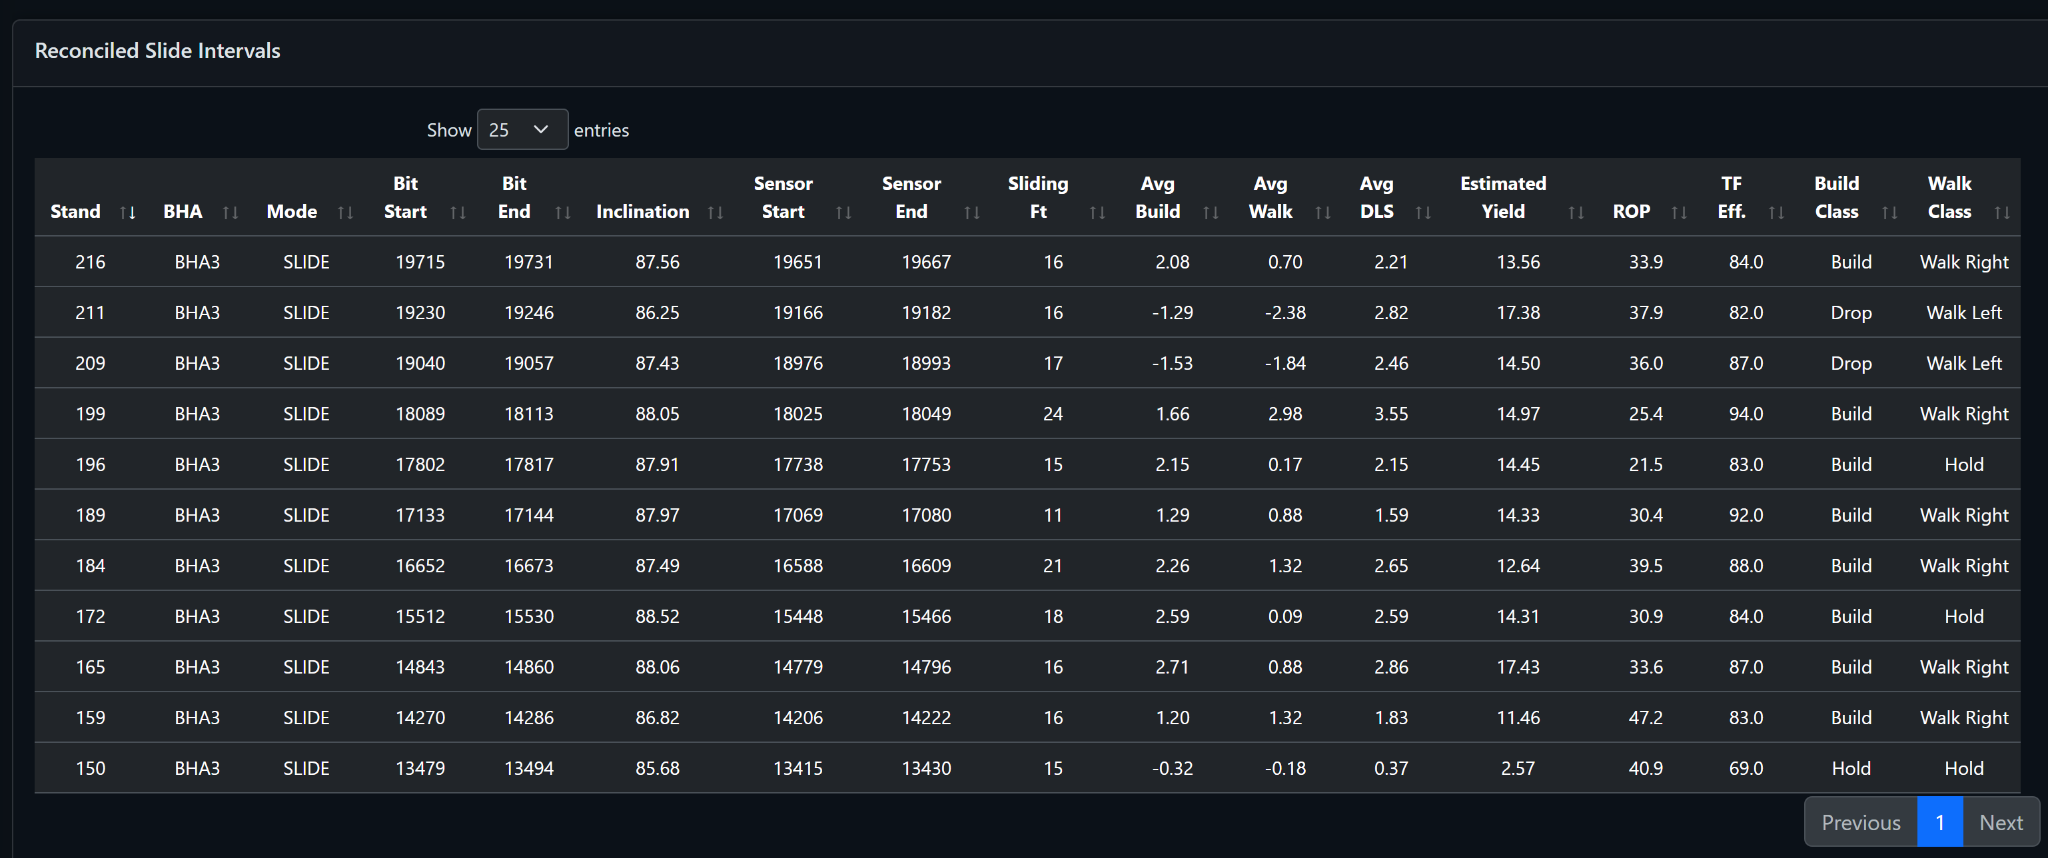
The reconciled slide-interval table links each detected slide with footage, ROP, build, walk, DLS, yield, and directional classification.
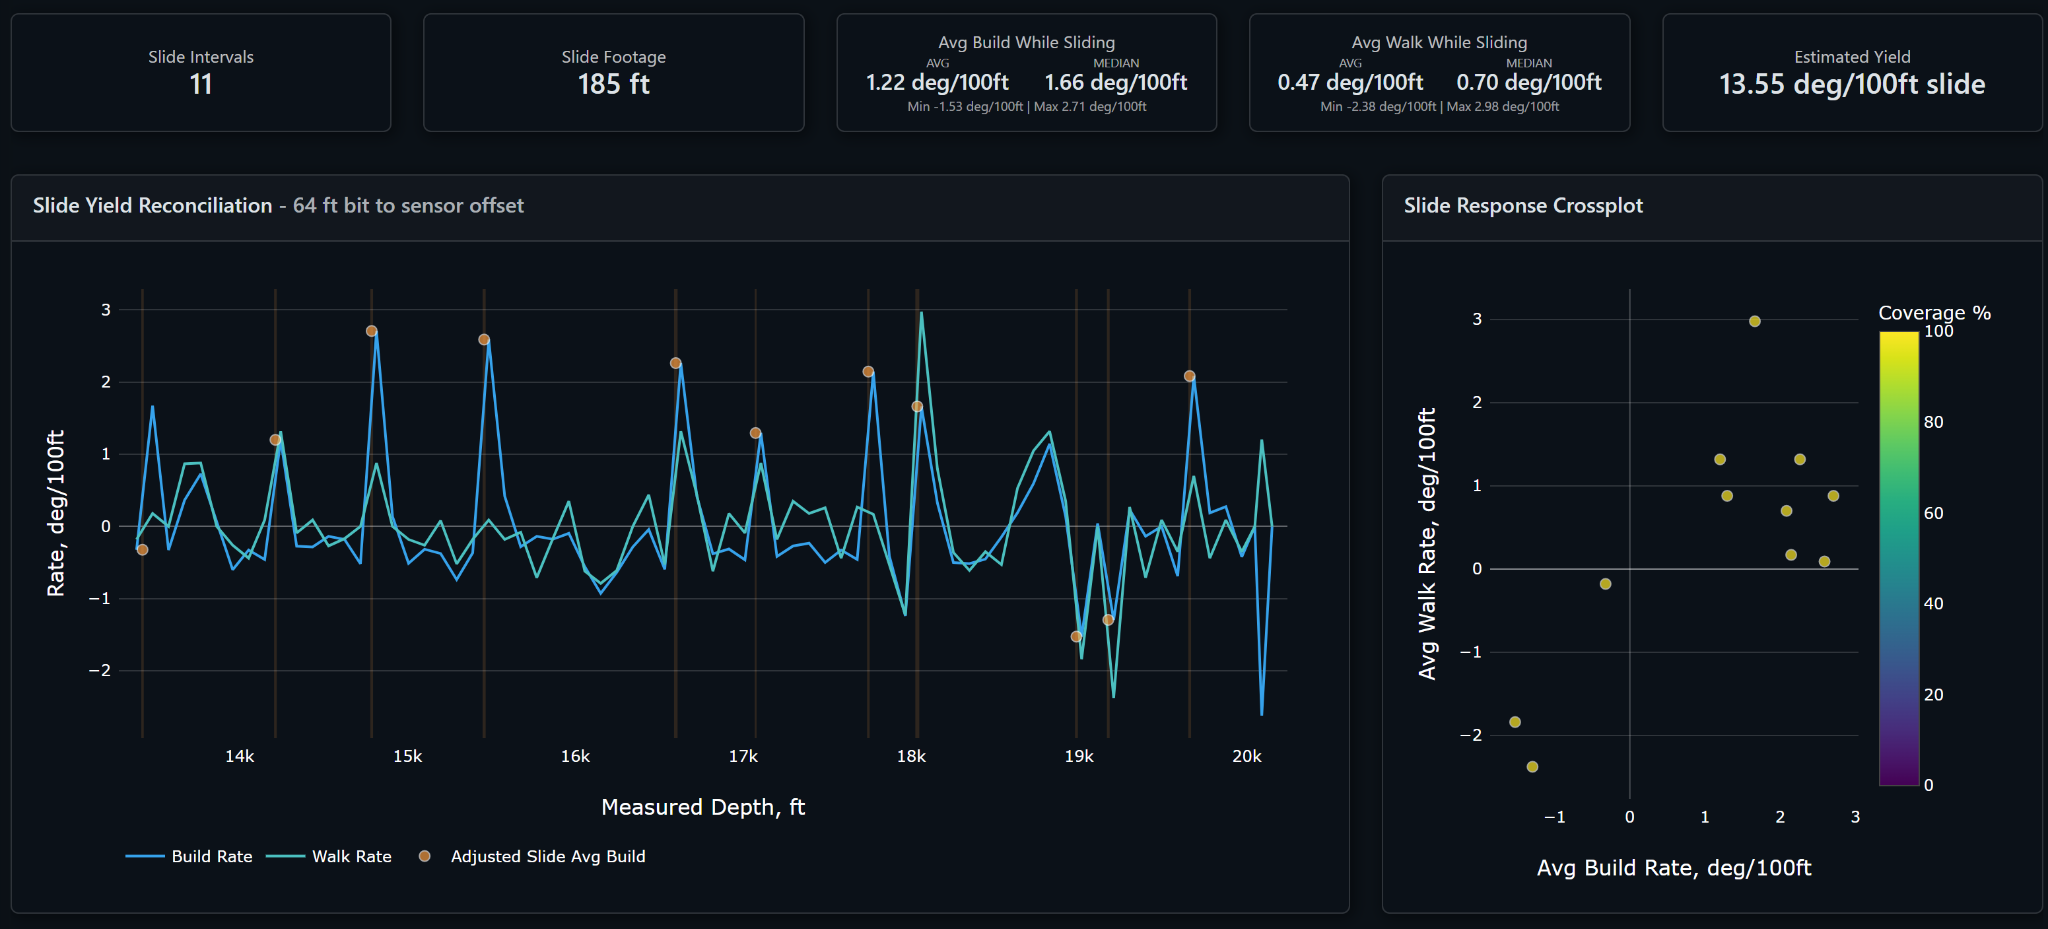
DrillingMetrics reconciles detected slide intervals with measured build and walk response so the directional outcome of each slide can be examined.
Viewed together, these perspectives help separate slower drilling within a mode from the additional directional work required to deliver the wellbore.
A Practical Analytical Workflow
A defensible workflow might be:
1. Classify rig state
Separate:
- rotary drilling,
- slide drilling,
- other operations.
2. Calculate mode-specific footage and time
For each mode determine:
- footage,
- time,
- ROP.
3. Calculate section-level performance
Preserve the actual combined operational result.
4. Quantify directional burden
Include:
- slide footage,
- slide percentage,
- event count / lengths where useful.
5. Add trajectory context
Review:
- planned geometry,
- inclination/azimuth tendency,
- required corrections.
6. Evaluate slide effectiveness
Use appropriate:
- directional response,
- toolface,
- motor/BHA context.
7. Evaluate rotary performance separately
Use:
- ROP,
- MSE,
- mechanical stability,
- BHA tendency.
8. Evaluate final wellbore quality
Do not optimize the mode mix without considering the resulting trajectory.
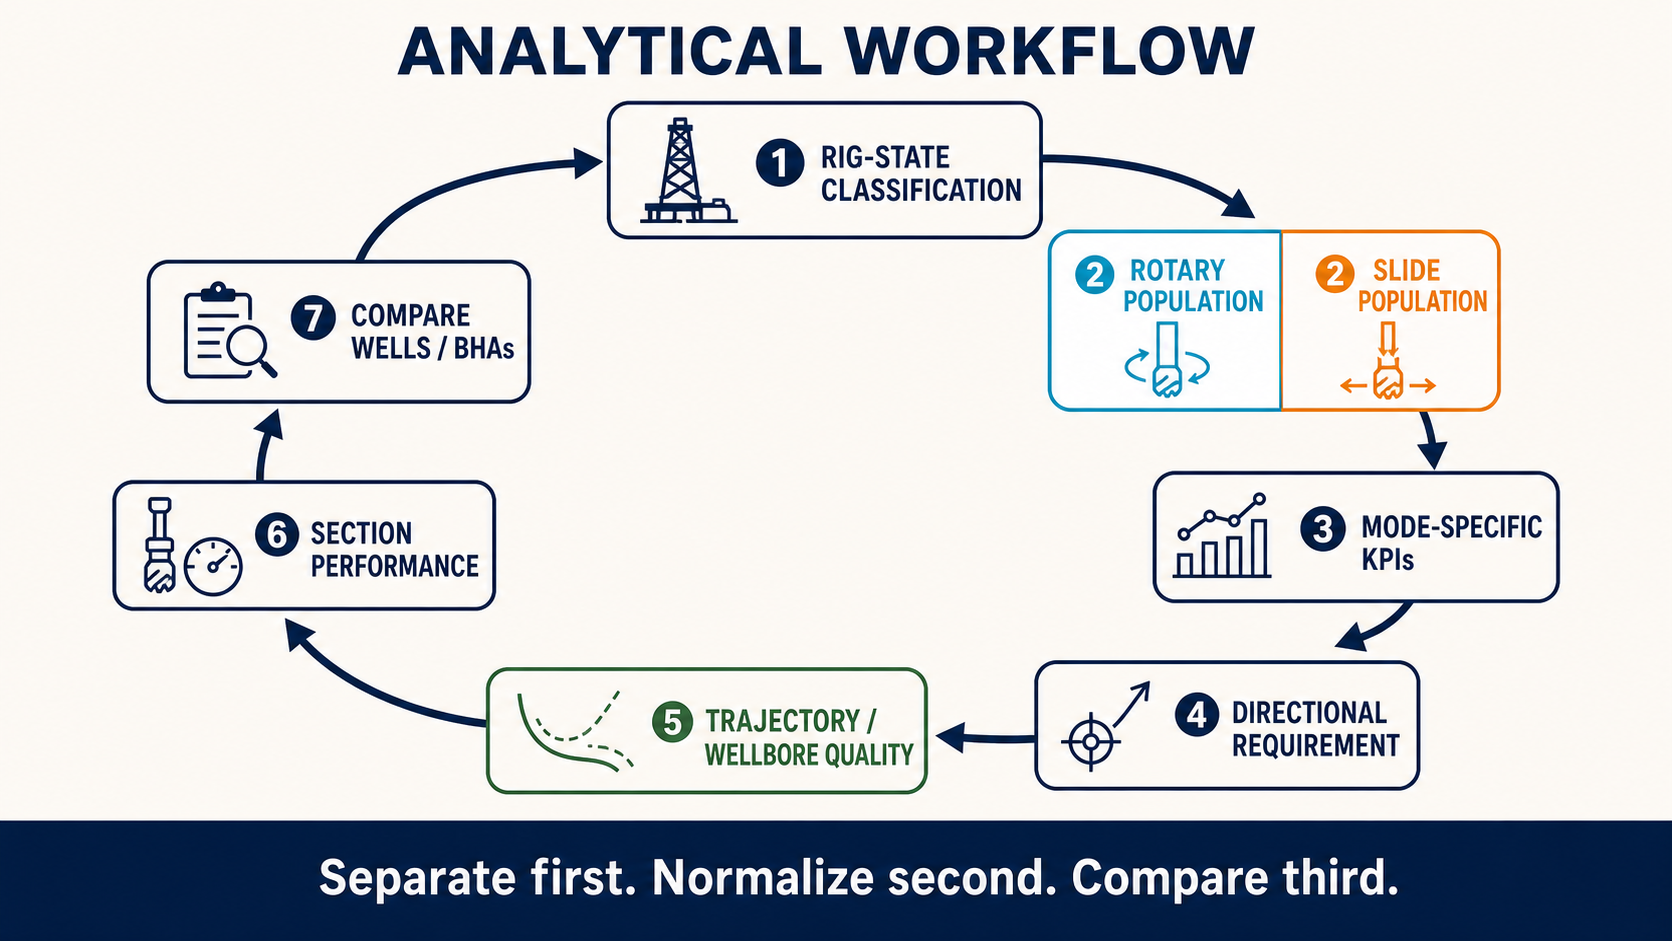
A defensible comparison separates rig states, normalizes mode-specific performance, and reconnects the result to trajectory and wellbore quality.
What Not to Do
Several analytical shortcuts should raise immediate concern.
Compare lateral average ROP without slide percentage
The population mix is unknown.
Treat slide footage automatically as inefficiency
Some steering is required.
Apply rotary MSE or WOB/RPM analysis unchanged to sliding
The underlying mechanics differ.
Compare slide ROP without directional outcome
Fast hole making alone does not establish slide effectiveness.
Rank drillers from one blended KPI
Formation, trajectory, BHA, and steering requirement may dominate the result.
A Better Performance Question
Instead of asking:
Which well had the best average ROP?
ask:
How much of the performance difference came from rotary efficiency, slide efficiency, and the amount of directional work required?
That question immediately produces a more useful analysis.
It separates:
execution
from:
requirement.
Conclusion
Slide drilling and rotary drilling both make new hole.
That is where their similarity largely ends.
Rotary drilling is primarily a continuous drilling process.
Slide drilling is simultaneously:
- a drilling process,
- a motor-driven process,
- a directional-control process.
Combining the two into one average ROP can therefore conceal why a lateral was fast or slow.
A slower whole-lateral ROP may result from:
- poor rotary performance,
- poor slide performance,
- greater directional requirement,
- unfavorable BHA tendency,
- or some combination.
The analytical solution is not to abandon section ROP.
It is to decompose it.
Measure:
- rotary performance,
- slide performance,
- directional burden,
- final section outcome.
Then reconnect those measurements using engineering context.
That allows a much better question than:
Which well drilled faster?
It allows us to ask:
What part of the drilling system actually created the difference, and is that difference something we can improve on the next well?
References
-
Ambrus, A., Ashok, P., Chintapalli, A., Ramos, D., Behounek, M., Thetford, T. S., and Nelson, B. A Novel Probabilistic Rig Based Drilling Optimization Index to Improve Drilling Performance. SPE-186166-MS, SPE Offshore Europe Conference & Exhibition, Aberdeen, United Kingdom, 2017.
-
Shahri, M., James, M., Vasicek, A., De Napoli, R., White, M., Behounek, M., D'Angelo, J., Ashok, P., and van Oort, E. Case Studies: Optimizing BHA Performance by Leveraging Data and Advanced Modeling. SPE-196020-MS, SPE Annual Technical Conference and Exhibition, Calgary, Alberta, 2019.
-
Witt-Doerring, Y., Pastusek, P. P., Ashok, P., and van Oort, E. Quantifying PDC Bit Wear in Real-Time and Establishing an Effective Bit Pull Criterion Using Surface Sensors. SPE-205844-MS, SPE Annual Technical Conference and Exhibition, 2021.