Practical Considerations in Offset-Well Benchmarking

Overlaying two wells is easy. Determining whether their ROP, drilling parameters, dysfunctions, and operational performance are actually comparable requires much more care.

Drilling engineers have always learned from offsets.

Before drilling a new section, it is natural to ask:

  • What ROP did the previous wells achieve?
  • What WOB and RPM worked?
  • Where did torque increase?
  • Which BHA performed best?
  • Where did stick-slip appear?
  • How long did the section take?
  • What happened when the formation changed?

Modern drilling databases make those questions much easier to investigate.

Instead of searching through morning reports, spreadsheets, screenshots, and manually prepared roadmaps, an engineer can place the active well beside several offsets almost instantly.

But easier comparison does not automatically mean better comparison.

Two wells can be plotted on the same depth axis and still represent different:

  • formations,
  • hole geometries,
  • bits,
  • BHAs,
  • mud systems,
  • motor conditions,
  • directional requirements,
  • drilling states,
  • or equipment limitations.

The curves may line up beautifully while the engineering comparison remains weak.

That leads to the central principle of offset-well benchmarking:

Before asking which well performed better, establish whether the observations being compared represent sufficiently similar drilling conditions.

Published field work has demonstrated both sides of this problem.

SPE/IADC-184743 describes a system that made real-time offset comparison practical by storing historical wells centrally and overlaying selected parameters by depth, with the ability to account for depth shifts and formation tops.[1]

But SPE-186166 shows why the resulting historical parameter values should not simply be copied onto the next well: even six wells from the same pad displayed different efficient WOB-RPM operating regions and different dysfunction behavior.[2]

The offset is evidence.

It is not automatically the answer.

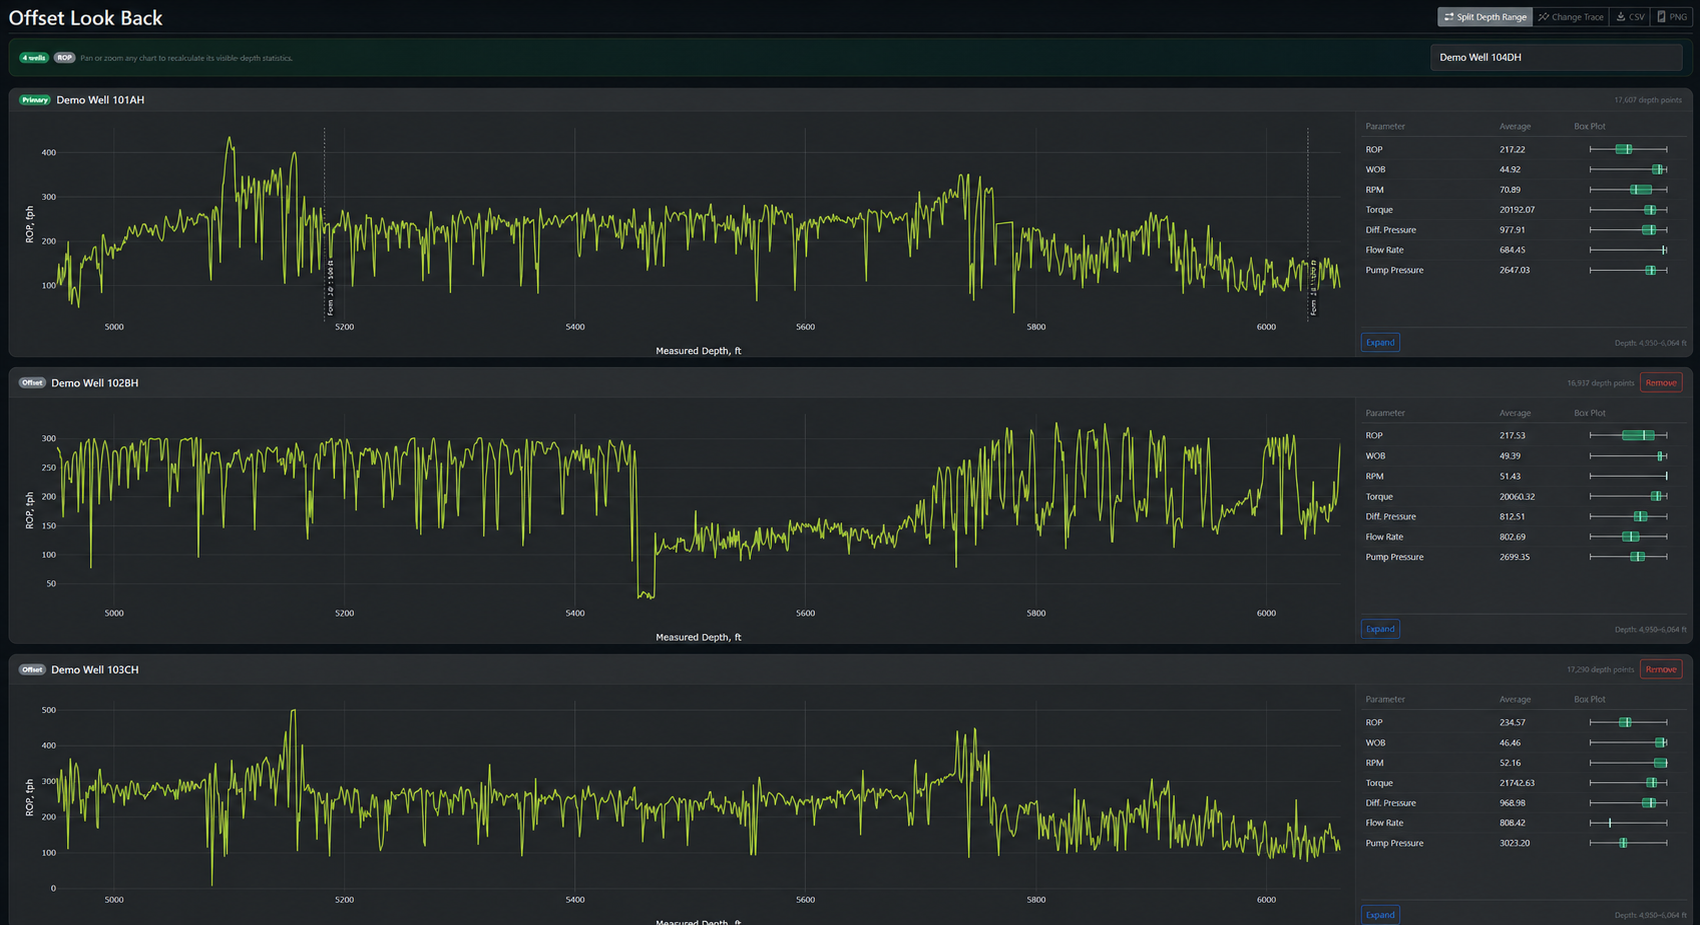
Three wells showing how aligned depth curves can still represent different formations, BHAs, bit conditions, drilling states, and mud systems.

Offset-well comparison becomes meaningful only after the drilling conditions behind the curves are understood.

The Closest Offset Is Not Necessarily the Best Benchmark

Geographic proximity is useful.

Wells on the same pad may share much of the same geological and operational environment.

But proximity alone does not guarantee comparable drilling behavior.

SPE-186166 examined six horizontal wells from the same pad specifically to create a relatively uniform comparison.[2]

Even under those favorable conditions, significant differences remained.

At one comparable depth, some wells drilled with high efficiency while others experienced stick-slip despite still achieving high ROP.

At another depth in the same formation, two wells operating with very similar WOB and RPM showed dramatically different drilling efficiency.[2]

Potential explanations included:

  • bit condition,
  • wellbore tortuosity,
  • hole cleaning,
  • mud motor condition,
  • and other operational differences.

That is a powerful warning.

If wells on the same pad can behave differently, a historical well should not be selected simply because it is:

the nearest well with data.

A better offset selection considers multiple dimensions of similarity.

These might include:

  • formation,
  • hole section,
  • trajectory,
  • hole size,
  • BHA type,
  • bit design,
  • motor or RSS configuration,
  • mud system,
  • rig capability,
  • directional objective,
  • drilling vintage.

No single criterion is always dominant.

The correct comparison depends on the engineering question.

First Define What You Are Benchmarking

“Best offset” is not a complete question.

Best at what?

A well can lead one metric and perform poorly in another.

For example:

Fastest ROP

may identify the most aggressive drilling interval.

Highest drilling efficiency

may identify the mechanically cleanest operating condition.

Lowest tortuosity

may identify the best directional outcome.

Lowest section time

includes both drilling and flat-time performance.

Best bit run

may emphasize footage, ROP, dull condition, or avoidance of trips.

Best connection performance

has little to do with bit or formation performance.

The benchmark population should therefore be constructed around the question.

If the question is:

What WOB and RPM worked well in this formation?

then the relevant observations should ideally be:

  • actual drilling,
  • in the comparable formation,
  • with comparable BHA/bit conditions,
  • under similar hole geometry,
  • and without major dysfunction.

If the question is:

Which rig drilled this section fastest?

the population and normalization requirements are different.

The benchmark follows the engineering question—not the other way around.

Depth Alignment Is Necessary but Not Sufficient

Most offset comparison begins with depth.

This is sensible because drilling decisions are heavily depth-dependent.

SPE/IADC-184743 describes a real-time offset-comparison system that plotted current and historical well data together by depth, allowed a depth adjustment to account for TVD shifts, and allowed formation tops to be marked.[1]

That functionality addresses an important problem.

Suppose Formation A begins at:

9,800 ft MD

in Offset Well A.

In the current well, it begins at:

10,050 ft MD.

A raw measured-depth overlay shifts the formation response by 250 ft.

The engineer may conclude:

The current well is drilling differently at 9,900 ft.

But the two traces are not actually in the same rock.

The comparison failed before the drilling parameters were even considered.
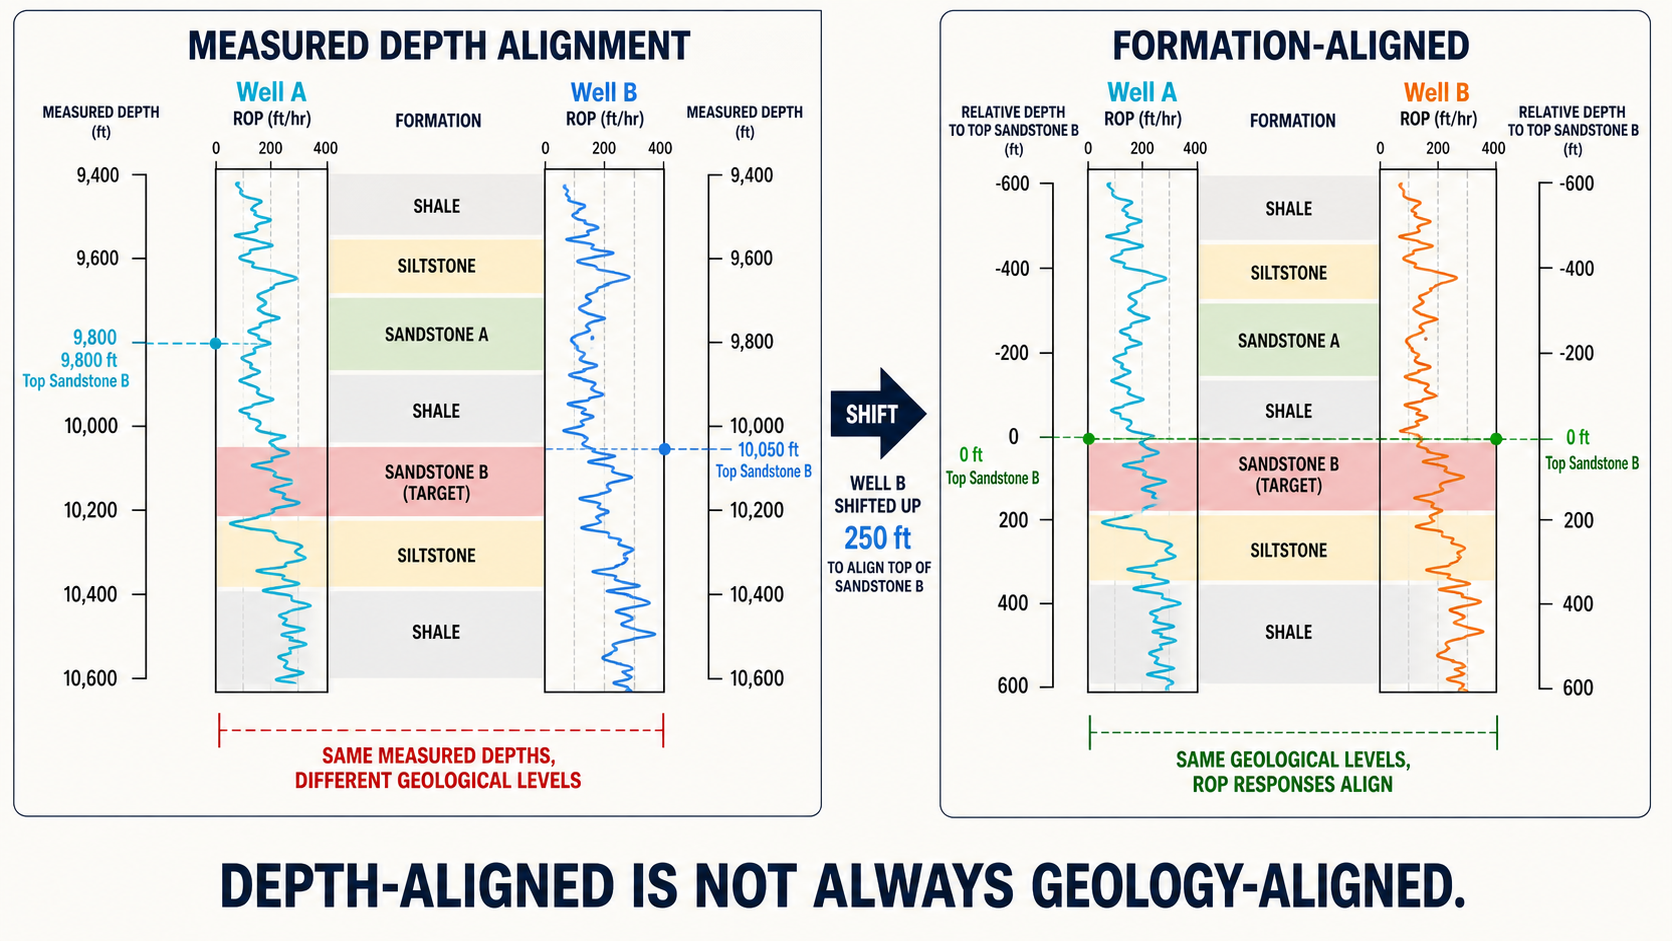
Measured-depth and formation-aligned ROP comparisons for two synthetic wells.

Measured-depth alignment can misplace comparable drilling behavior when geological boundaries shift between wells.

MD, TVD, and Geological Position Answer Different Questions

Depth normalization is not one universal operation.

Measured Depth

is useful when the physical amount of drilled hole matters.

Examples:

  • trip distance,
  • torque and drag,
  • bit footage,
  • section length.

True Vertical Depth

can be more useful when comparing vertically separated geology.

But TVD alone does not guarantee equivalent stratigraphic position.

Formation-relative depth

may be more appropriate when comparing:

  • ROP response,
  • MSE,
  • lithology-related behavior,
  • drilling parameter effectiveness.

For example, one might compare:

$$Depth_{relative} = Depth - Formation\ Top$$

so that zero represents the same geological reference in each well.

The important point is not that every comparison should use formation-relative depth.

It is:

The depth basis should correspond to the engineering phenomenon being compared.

One Global Depth Shift May Not Solve the Entire Well

A simple depth shift can be extremely useful.

But it assumes geological differences between the wells can be represented reasonably well by one offset.

That may not always be true.

Consider two formation tops:

Formation Offset A Current Well
Top X 9,800 ft 10,000 ft
Top Y 11,200 ft 11,520 ft

At Top X, the shift is:

$$+200\ ft$$

At Top Y:

$$+320\ ft$$

Applying one +200-ft correction aligns the first boundary but leaves the second one misaligned.

A more sophisticated comparison may therefore need:

  • multiple formation anchors,
  • section-specific alignment,
  • or geological rather than purely numerical depth normalization.

This is particularly important when comparing long laterals or wells with structural variation.

Two wells showing a single global depth shift compared with multiple formation anchors.

Structural variation may require more than one fixed depth correction.

Compare Drilling with Drilling

The rig-state article established a critical rule:

Valid sensor data generated during the wrong operation is still inappropriate for the analysis.

That rule becomes especially important in offset comparison.

Suppose Offset A contains:

  • rotary drilling,
  • reaming,
  • connections,
  • circulation.

Current Well B is filtered to:

  • rotary drilling only.

If all Offset A data is averaged by depth, the comparison is contaminated.

ROP may be lower.

Torque behavior may be different.

WOB may contain off-bottom or transitional observations.

The wells now appear mechanically different partly because the populations were defined differently.

A fair drilling-performance comparison should normally match:

rotary drilling ↔ rotary drilling

or:

slide drilling ↔ slide drilling

rather than simply:

same depth ↔ same depth.

SPE-186166 explicitly filtered its six-well comparison to rotary-drilling observations to improve uniformity.[2]

That filtering step is as important as the plot itself.

:contentReference[oaicite:4]{index=4}

Slide and Rotate Performance Should Usually Be Separated

This deserves special attention in directional wells.

Rotary drilling and sliding have fundamentally different mechanical conditions.

During sliding:

  • surface RPM may be zero,
  • the motor supplies bit rotation,
  • toolface control matters,
  • directional requirements may constrain WOB and flow,
  • effective downhole RPM differs from surface measurements.

Combining slide and rotate data can therefore make a well with more sliding appear:

  • slower,
  • mechanically different,
  • less efficient

even when the actual rotary performance is equivalent.

SPE-186166 itself notes that slide-drilling efficiency is more difficult to quantify without additional real-time directional and BHA context.[2] :contentReference[oaicite:5]{index=5}

A lateral comparison should therefore ask:

Did Well A outperform Well B because it drilled more efficiently?

or:

Did Well A simply require less slide footage?

Those are very different lessons.

Unfiltered and rotary-only ROP comparisons showing the effect of different slide requirements.

Different directional requirements can distort whole-section ROP comparisons; rotary-only filtering can reveal a fairer comparison.

Normalize the Hole Section Before Ranking the Well

Consider two wells.

Well A

  • lateral ROP: 210 ft/hr
  • 85% rotary
  • 15% slide

Well B

  • lateral ROP: 185 ft/hr
  • 65% rotary
  • 35% slide

Calling Well A's drilling system better may be premature.

Perhaps both wells achieved approximately the same ROP while rotating.

The total difference may be dominated by directional requirement.

Now suppose Well B also followed a more difficult planned trajectory.

That adds another confounding variable.

This is why a strong offset comparison distinguishes between:

  • drilling-system performance,
  • directional requirement,
  • planned geometry,
  • flat-time execution.

A whole-well ranking can obscure the process actually responsible for the difference.

Same WOB and RPM Do Not Mean the Same Operating Point

WOB and RPM are often treated as portable recipes.

For example:

The best offset drilled this interval at 35 klbf and 130 RPM.

Therefore:

Start the next well at 35 klbf and 130 RPM.

Historical parameters are useful starting information.

But SPE-186166 demonstrates why they should not automatically be treated as optimum settings.[2]

At a common lateral depth, two wells operating at similar WOB and RPM showed substantially different calculated drilling efficiency.

The paper suggests several possible contributors:

  • bit condition,
  • tortuosity,
  • hole cleaning,
  • mud-motor condition.

In other words:

$$Performance \neq f(WOB,RPM)\ only$$

A more realistic conceptual relationship is:

$$Performance = f( WOB, RPM, Formation, Bit, BHA, Hydraulics, Hole\ Condition, Dynamics, ... )$$

This is why an offset parameter should be viewed as:

a historically successful operating point under a specific set of conditions.

Not as:

a universal optimum.

Two wells operating at the same WOB and RPM but showing different torque, ROP, and mechanical-efficiency responses.

A WOB-RPM pair does not fully describe the drilling system or guarantee the same response.

Formation Context Changes the Meaning of ROP

Suppose an offset drilled at:

240 ft/hr

while the current well is at:

180 ft/hr.

Is the current well underperforming?

Only if the formations are comparable.

A stronger or more abrasive interval may legitimately require:

  • higher mechanical energy,
  • lower ROP,
  • different WOB/RPM combination.

SPE-186166 emphasizes formation strength as relevant context for interpreting drilling efficiency and also notes that formation changes can contribute to apparent dysfunction or MSE changes.[2]

This suggests a better benchmark:

How does current performance compare with offsets while drilling comparable rock?

rather than:

Which ROP trace is farther to the right?

BHA and Bit Context Should Travel with the Performance Data

Historical drilling data becomes much more useful when the performance trace is attached to the configuration that generated it.

For each interval, useful metadata might include:

  • bit manufacturer/model,
  • bit size,
  • dull history,
  • motor bend,
  • motor power section,
  • RSS versus conventional assembly,
  • stabilizer placement,
  • BHA run number,
  • accumulated bit footage,
  • on-bottom hours.

Without that context, a high-performing interval can become misleading.

For example:

The offset may have entered the interval with a fresh bit.

The current well may already have:

5,000 ft on the bit.

The same ROP should not necessarily be expected.

Likewise, a BHA optimized for directional responsiveness may operate differently from one optimized for lateral stability.

Compare Distributions, Not Just One Average

Suppose three offsets have lateral rotary ROP:

  • Well A average = 205 ft/hr
  • Well B average = 198 ft/hr
  • Well C average = 200 ft/hr

The averages look nearly identical.

But their distributions might be very different.

Well A

Most footage between:

190–220 ft/hr.

Well B

Half the footage near 130 ft/hr and half near 270 ft/hr.

Well C

Most footage around 200 ft/hr with a few extreme spikes.

Those wells do not represent the same drilling behavior.

Useful statistics might include:

  • median,
  • P25,
  • P75,
  • P90,
  • interquartile range,
  • footage-weighted distributions.

This is especially useful when constructing a benchmark from several offsets.

Instead of choosing:

one best well

we can create an envelope.

For example:

At a particular formation-relative depth:

  • P25 ROP = 175 ft/hr
  • median = 205 ft/hr
  • P75 = 230 ft/hr

Now the active well can be evaluated against a population rather than one historical path.
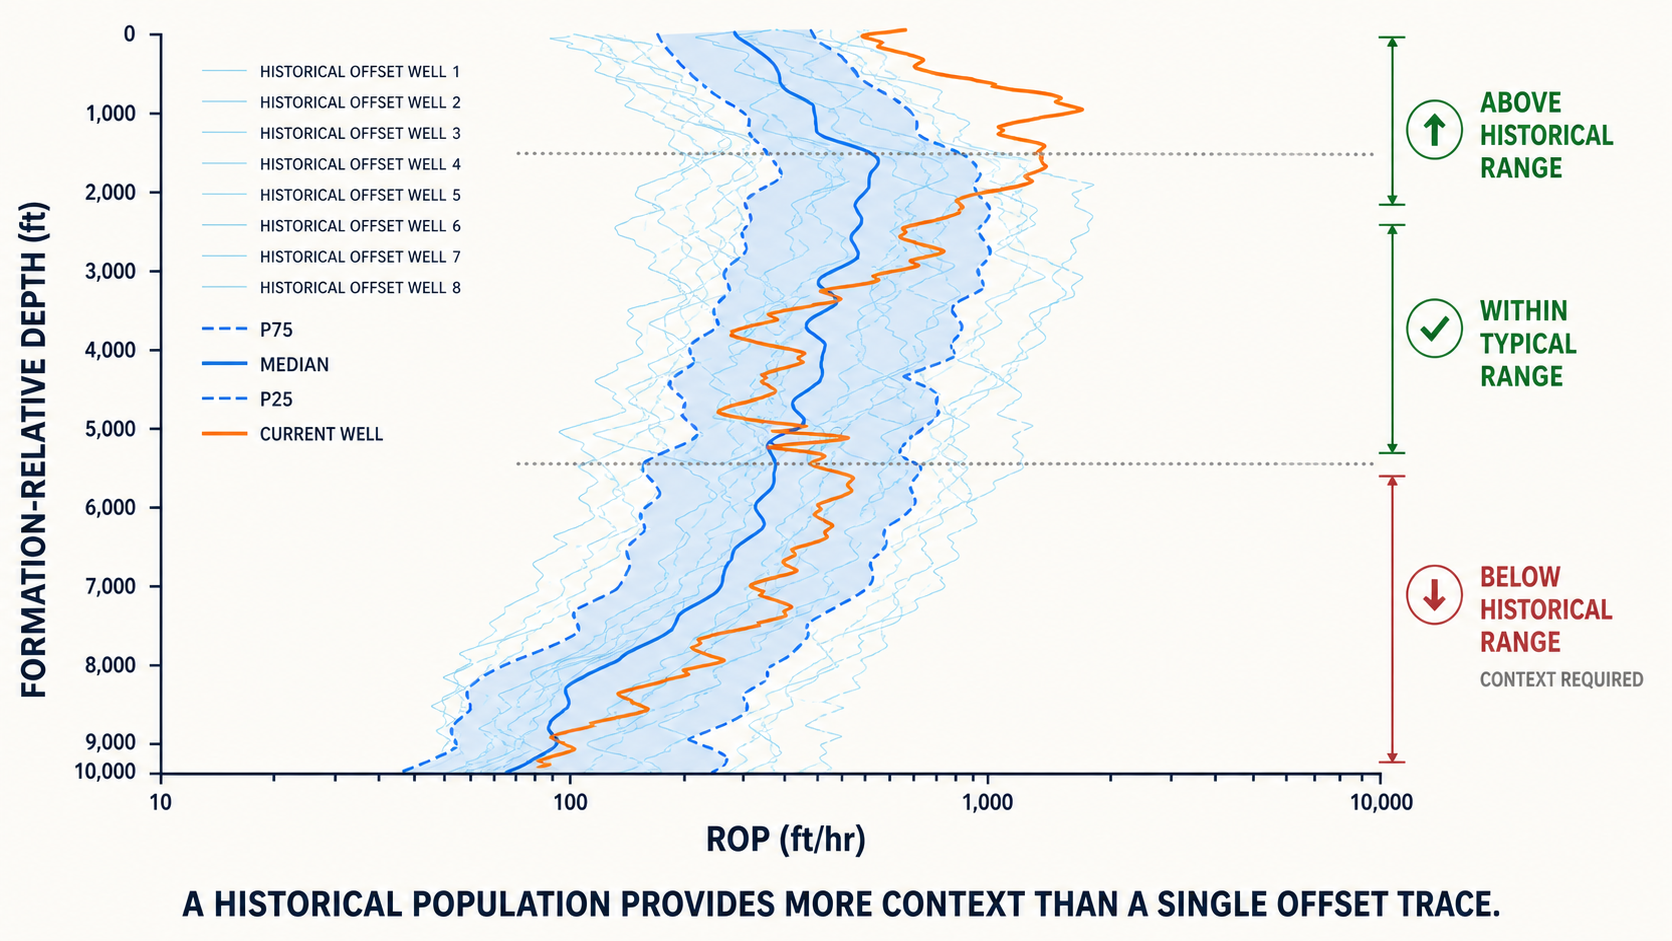
Eight historical ROP traces with P25, median, P75, and the current-well response versus formation-relative depth.

A multi-well performance envelope can provide a more robust benchmark than a single selected offset.

The Best Historical Well Can Be a Dangerous Benchmark

Suppose ten wells have been drilled.

The fastest well is selected.

Its peak ROP is treated as the target.

Several problems arise.

The fastest well may have benefited from:

  • favorable geology,
  • unusually fresh equipment,
  • fewer directional corrections,
  • better hole condition,
  • an operating point that would not be sustainable elsewhere.

This creates a form of selection bias.

By definition, the single best well represents an extreme outcome.

That does not make it useless.

It means it should be interpreted as:

evidence of what has been achievable

rather than:

what every subsequent well should achieve continuously.

A more defensible framework can use several levels:

Typical

Median historical performance.

Strong

Upper-quartile historical performance.

Demonstrated best

Best repeatable performance under comparable conditions.

That produces a roadmap with realistic ambition rather than one built entirely from isolated records.

Beware of Copying Dysfunction Along with Performance

Suppose the fastest offset achieved:

250 ft/hr

while operating at:

  • high WOB,
  • low RPM.

But torque data shows strong stick-slip throughout the interval.

Should those WOB/RPM values become the roadmap?

Not automatically.

This is exactly why the high-ROP article emphasized separating speed from efficiency.

SPE-186166 found field cases in which high ROP coexisted with lower drilling-efficiency values caused by stick-slip.[2]

An offset benchmark should therefore evaluate not only:

What produced high ROP?

but:

What produced high ROP without unacceptable dysfunction?

The desirable historical operating envelope is the intersection of:

  • strong ROP,
  • acceptable dynamics,
  • acceptable hole quality,
  • sustainable equipment condition.

Two historical wells comparing the fastest ROP result with more stable sustainable performance.

Fastest and sustainable performance represent different engineering objectives; the benchmark should match the question.

Historical Parameters Should Be a Starting Point

One of the strongest conclusions from SPE-186166 is that post-well drilling parameters should be used cautiously.[2]

The authors found that efficient operating regions could vary substantially even among wells on the same pad and concluded that historical parameter selections are useful starting points while real-time data should guide further adjustment.

:contentReference[oaicite:6]{index=6}

That produces a useful operating philosophy:

Before entering the interval

Use offsets to establish:

  • plausible WOB range,
  • plausible RPM range,
  • expected ROP,
  • known dysfunction areas,
  • known mechanical limitations.

Once drilling begins

Use the active well to determine:

  • whether performance matches the expectation,
  • whether dysfunction appears,
  • whether formation response differs,
  • whether parameter adjustment is justified.

The historical data establishes the prior.

The current well supplies new evidence.

DrillingMetrics Offset Look Back comparing a primary Demo Well with depth-aligned historical Demo Wells and visible-interval operating statistics.

Depth-aligned DrillingMetrics offset comparison allows the active Demo Well to be evaluated against historical ROP and operating-parameter distributions over the visible interval.

Offset Benchmarking Should Be Dynamic

Traditional roadmaps are often static.

For example:

Depth WOB RPM
10,000–11,000 28 120
11,000–12,000 32 130
12,000–13,000 35 140

That is easy to communicate.

But the table hides why those values were chosen.

A richer benchmark can include:

  • expected ROP range,
  • historical parameter distribution,
  • dysfunction history,
  • formation boundaries,
  • BHA context,
  • confidence in the comparison.

Then the roadmap becomes less of a recipe and more of an evidence package.

A Practical Example

Assume the current well is approaching a lateral formation interval.

Three nearby offsets are available.

Offset A

  • rotary ROP median: 215 ft/hr
  • WOB: 32–38 klbf
  • RPM: 110–130
  • minimal dysfunction
  • same BHA family

Offset B

  • rotary ROP median: 235 ft/hr
  • WOB: 42–48 klbf
  • RPM: 75–90
  • frequent stick-slip

Offset C

  • rotary ROP median: 190 ft/hr
  • WOB: 30–35 klbf
  • RPM: 115–135
  • older bit entering interval
  • significant slide requirement

Which one is the best benchmark?

There is no reason to choose only one.

A stronger interpretation is:

  • Offset A provides the cleanest initial mechanical operating range.
  • Offset B demonstrates that higher instantaneous ROP has been achieved but under less desirable torsional conditions.
  • Offset C provides useful lower-performance context, but its bit age and directional requirement reduce direct comparability.

An initial roadmap might therefore begin near the operating range demonstrated by Offset A.

But once the current well enters the interval, its own:

  • ROP,
  • torque behavior,
  • MSE,
  • dysfunction indicators,
  • directional response

should determine whether parameters are moved.

That is a much stronger use of historical data than simply copying the fastest well.

Offset Selection Should Be Explicit

When an engineer builds a comparison, it is worth recording why each well was included.

For example:

Included because:

  • same pad,
  • same target formation,
  • same hole size,
  • comparable BHA family,
  • recent drilling campaign.

Potential differences:

  • different bit model,
  • different mud system,
  • longer bit footage entering interval.

This simple metadata prevents historical comparison from becoming detached from engineering judgment.

It also helps another engineer understand why the same offsets were—or were not—used later.

Comparison Quality Can Be Thought of as a Hierarchy

A useful conceptual hierarchy is:

Weak comparison

Same field.

Better

Same pad / nearby geology.

Better still

Same formation and hole section.

Stronger

Same formation + comparable geometry + drilling state.

Strongest

Same formation + geometry + operation + similar BHA/bit/hydraulics, with sufficient historical population.

The real world rarely provides perfect matches.

The objective is not to eliminate every difference.

It is to know which differences remain.

Five-level hierarchy showing progressively stronger offset comparability as geological and operational context is aligned.

Offset comparability strengthens as geology, hole section, rig state, and equipment context are aligned, even when differences remain.

The Current Well Should Eventually Replace the Offset as the Best Evidence

Offsets are most valuable before the active interval has been drilled.

As the new well accumulates footage, something changes.

The active well begins creating its own dataset.

At first:

$$Historical\ Evidence > Current\ Well\ Evidence$$

After several stands of stable drilling:

the current well may provide a much better description of:

  • its own formation response,
  • its bit condition,
  • its BHA behavior,
  • its hole-cleaning state.

At that point the analytical emphasis should gradually shift.

The decision becomes:

What are the offsets telling us?

plus:

What is this well telling us right now?

This is where real-time benchmarking becomes much more powerful than a static pre-job roadmap.

Timeline showing historical offset evidence guiding the initial operating point before current-well evidence becomes the primary guide.

Historical evidence guides the initial operating point; current-well learning should gain influence as live data accumulates.

A Practical Offset-Benchmarking Workflow

A defensible workflow might be:

1. Define the question

Are you benchmarking:

  • ROP?
  • drilling efficiency?
  • WOB/RPM?
  • connection time?
  • BHA performance?
  • total section time?

2. Select candidate offsets

Consider:

  • formation,
  • location,
  • hole section,
  • trajectory,
  • bit/BHA,
  • operating environment.

3. Normalize depth

Choose:

  • MD,
  • TVD,
  • formation-relative depth,
  • or another appropriate basis.

4. Filter operational state

Compare:

  • rotary with rotary,
  • slide with slide,
  • trip with trip.

5. Attach context

Include:

  • BHA,
  • bit,
  • mud,
  • motor/RSS,
  • hole size,
  • bit age.

6. Compare distributions

Use:

  • median,
  • percentiles,
  • variation,
  • not only averages and maxima.

7. Include dysfunction and quality measures

Do not benchmark ROP without checking:

  • torque behavior,
  • MSE,
  • stick-slip / whirl evidence,
  • wellbore quality where available.

8. Build an operating envelope

Prefer:

  • demonstrated ranges,
  • multi-well distributions,
  • confidence bands

over one exact parameter prescription.

9. Update from the current well

As the interval develops, allow live evidence to modify the historical expectation.

Closed-loop offset-benchmarking workflow from engineering question through normalization, operating envelope, and current-well feedback.

A robust benchmark is constructed through normalization and continuously updated as the active well produces new evidence.

The Goal Is Not to Reproduce the Best Offset

Offset benchmarking is sometimes treated as replication.

Find the best well.

Copy its parameters.

Try to reproduce its result.

The published evidence suggests a more useful philosophy.

SPE-186166 found that optimal operating regions varied significantly even among wells on the same pad and specifically cautioned that post-well parameter analysis should be treated as a starting point rather than a guaranteed optimum.[2]

The role of the offset is therefore not to tell the driller exactly what to do.

It is to narrow the search.

A good benchmark tells us:

  • what has worked,
  • where it worked,
  • under what conditions,
  • what performance range was achieved,
  • what dysfunctions accompanied it,
  • and how much variability exists.

The active well then determines whether those historical lessons still apply.

That is the difference between:

copying historical parameters

and

using historical evidence to make a better real-time decision.


References

  1. Behounek, M., Thetford, T., Yang, L., Hofer, E., White, M., Ashok, P., Ambrus, A., and Ramos, D. Human Factors Engineering in the Design and Deployment of a Novel Data Aggregation and Distribution System for Drilling Operations. SPE/IADC-184743-MS, SPE/IADC Drilling Conference and Exhibition, The Hague, Netherlands, 2017.

  2. Ambrus, A., Ashok, P., Chintapalli, A., Ramos, D., Behounek, M., Thetford, T. S., and Nelson, B. A Novel Probabilistic Rig Based Drilling Optimization Index to Improve Drilling Performance. SPE-186166-MS, SPE Offshore Europe Conference & Exhibition, Aberdeen, United Kingdom, 2017.

  3. Behounek, M., Millican, B., Nelson, B., Wicks, M., Rintala, E., White, M., Thetford, T., Ashok, P., and Ramos, D. Change Management Challenges Deploying a Rig-Based Drilling Advisory System. SPE/IADC-194184-MS, SPE/IADC International Drilling Conference and Exhibition, The Hague, Netherlands, 2019.